secondary title
So far, NFT sales on Ethereum have exceeded $9 billion in 2021, a 2,500% increase over 2020's total sales. 2021 is the first year of NFT, and it appears against the background of the bull market cycle. The scale of the NFT market is showing an astonishing growth trend, with a market value exceeding tens of billions of dollars.
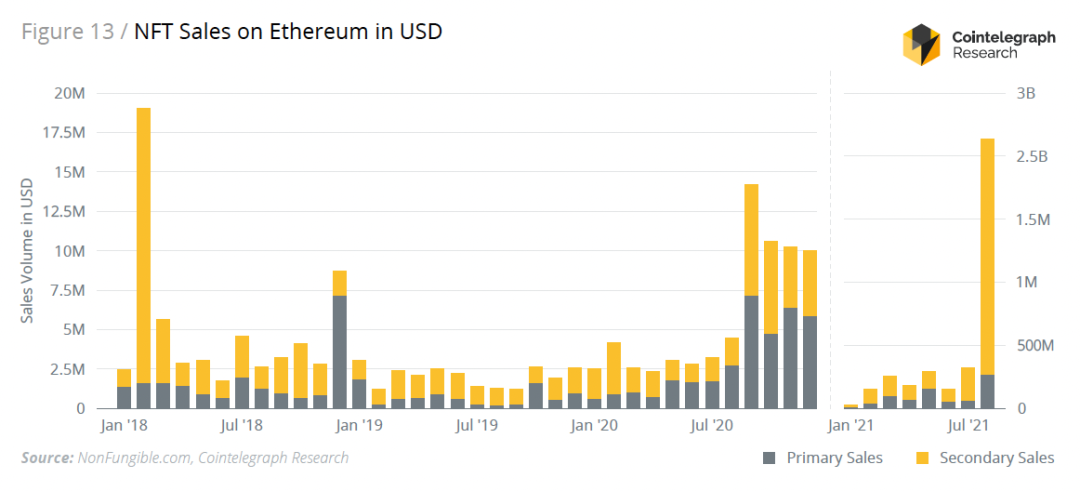
NFT sales on Ethereum (USD) 2018-2021, data source: NonFungible.com, Cointelegraph Research
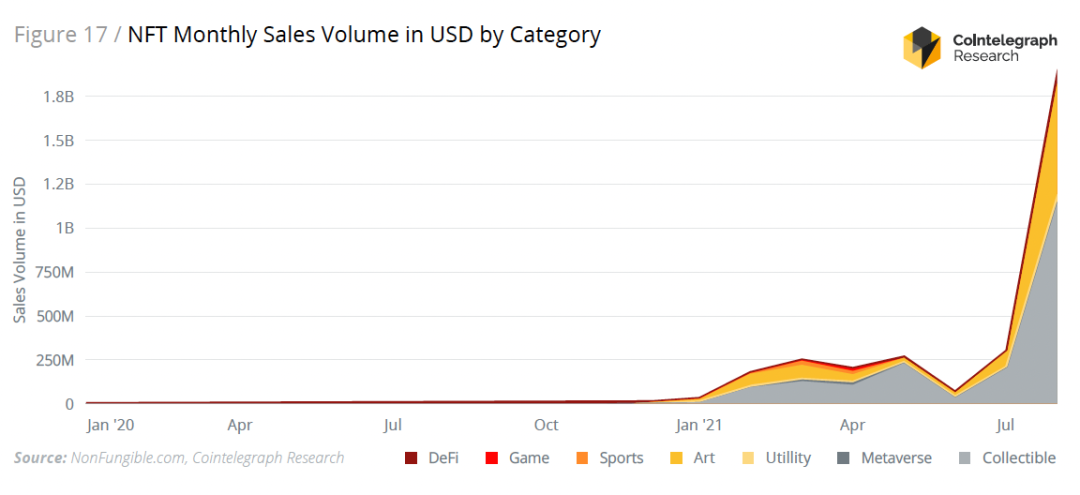
Collectibles (collectibles) and Art (art) NFTs will dominate the market in 2021, contributing more than 90% of sales. Early NFT sales were mainly dominated by Collectibles (collectibles) such as CryptoKitties and CryptoPunks. In late 2019, as the player base of games such as F1 DeltaTime, Gods Unchained, and Decentraland expanded, the number of transactions in the Game (game) NFT category surged. In mid-2020, the number of transactions of Sports (sports) and Metaverse (metaverse) NFT projects began to climb. Around the same time, Art (art) NFTs were also gaining traction, peaking with Beeple's record-setting sales in January 2021. Although the overall share of Collectibles transactions has declined, they still dominate total sales and lead items by a significant margin. The Art category followed Collectibles in sales volume, reflecting the higher valuations of both Art and Collectibles.
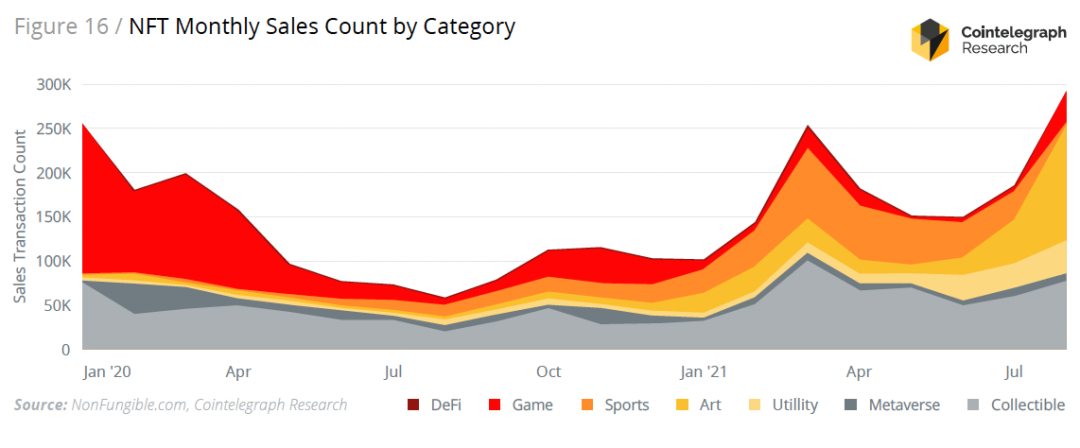
Monthly sales volume of different types of NFT, data source: NonFungible.com, Cointelegraph Research
text
The popularity of the P2E (Play to earn) concept, making money through games has fundamentally changed the distribution of economic power among different stakeholders in the game ecosystem. The market expects that as the NFT market matures, GameFi will become the next NFT growth point. In March 2021, blockchain games based on the GameFi concept began to rise. In July, GameFi games represented by Axie Infinity ushered in explosive growth. Take the metaverse games Decentraland and The SandBox as examples. Each land in the game corresponds to an NFT. The owner of each NFT represents that he owns the land and can create and transform it.
GameFi is a combination of DeFi+Game+NFT, mainly due to the maturity of DeFi and NFT technology and products. NFT provides the living soil for GameFi and becomes one of the value carriers of its in-game economic system, which makes the market performance of many GameFi projects stand out, and makes GameFi quickly become one of the most popular fields this year.In turn, GameFi has fueled the continued popularity of NFTs.
Although transaction fees are generally higher than the price of NFTs, Ethereum currently processes over 80% of sales. However, alternative layer one solutions including Flow, Tezos, and Wax are becoming more common due to lower transaction fees and energy consumption.
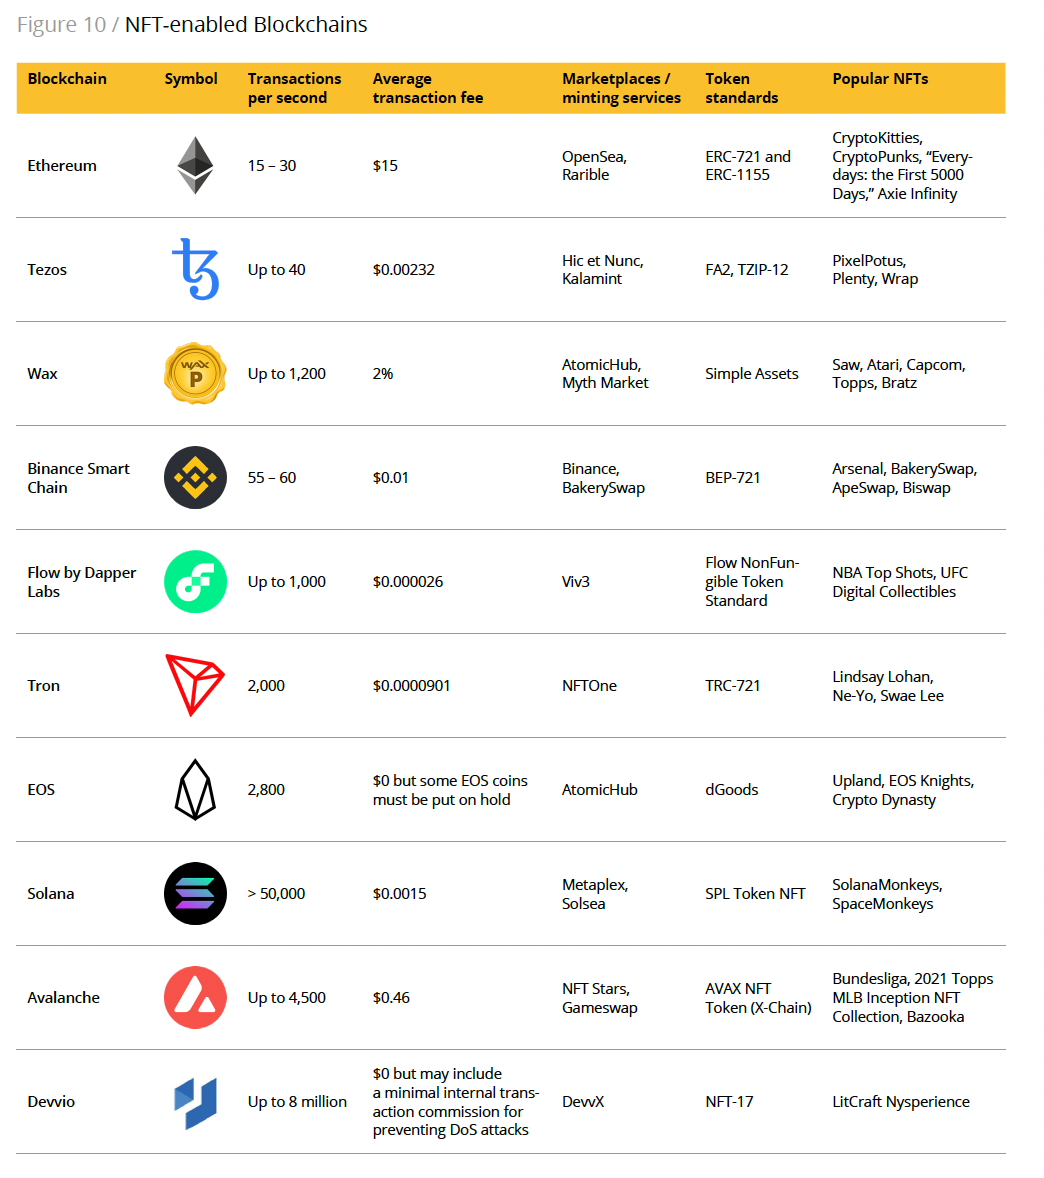
image description
Blockchain that supports NFT, data source: NonFungible.com, Cointelegraph ResearchIn 2021, transactions on Tezos will be more than 35,000 times more energy efficient than those on Ethereum. To put that in perspective, a single transaction on Ethereum requires about 30 kWh, which is equivalent to powering a house in the US for an entire day. In comparison, a transaction on Tezos consumes 0.0016 kWh or less than the energy required to charge an Apple Tablet for 10 minutes.
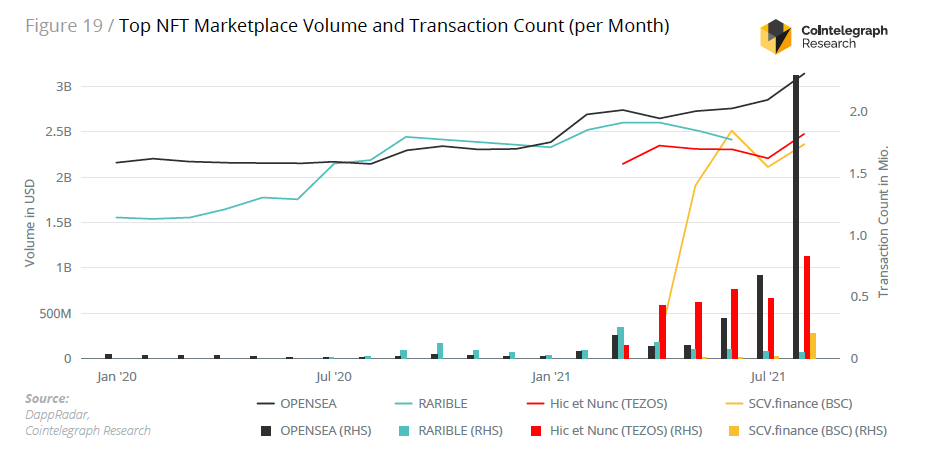
image description
Monthly trading volume (unit: USD) and number of transactions (unit: unit) of the leading NFT market, data source: NonFungible.com, Cointelegraph ResearchUnder the leadership of Ethereum (Ethereum) DApps (decentralized applications) OpenSea and Rarible, NFT sales in the head market have shown an amazing growth curve. However,Growth of these platforms is limited by Ethereum’s high transaction fees
Entering the whitelist can effectively increase the ROI of investing in NFT. OpenSea data shows that 75.7% of users who were whitelisted and subsequently sold their newly minted NFTs made a profit, compared to only 20.8% of users who were not whitelisted.
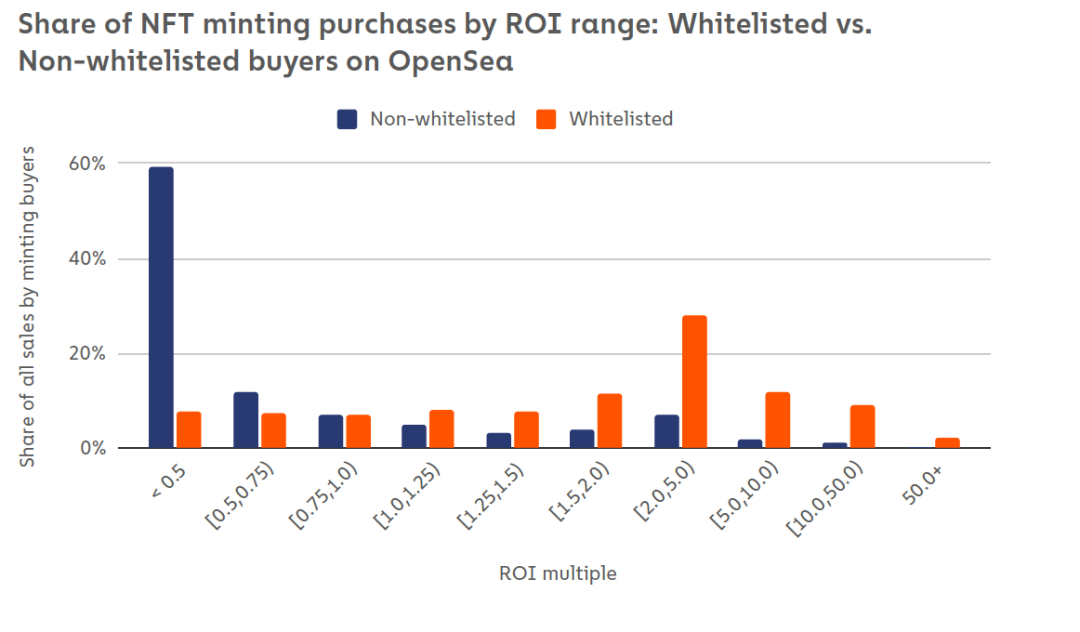
image description
A large investment amount and a diversified portfolio are more effective for a resale strategy. According to OpenSea, the top 30% of addresses accounted for 87% of all NFT resale shares and 107% of all realized gains.
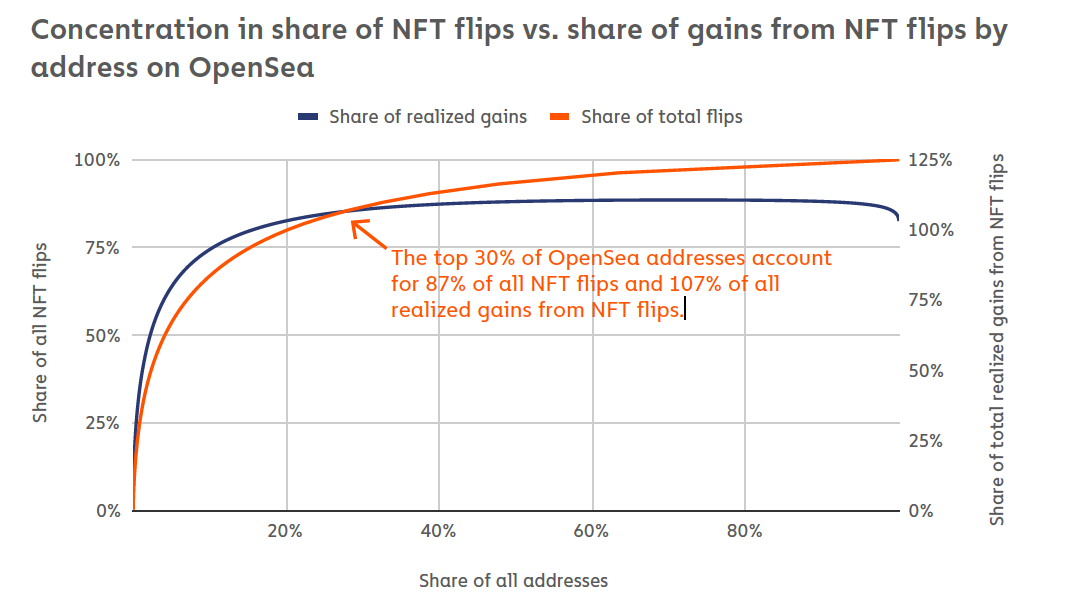
image description
DAO is booming. DAO is a decentralized organization, and its full name is Decentralized Autonomous Organization. DAO is a form of organization that encodes the organization's management and operating rules in the form of "smart contracts" on the blockchain, so that it can operate autonomously without centralized control or third-party intervention. DAO is expected to become a new type of effective organization to deal with uncertain, diverse and complex environments. 2021 has witnessed the market sensation caused by DAO, PunksDAO sparked heated discussions, and witnessed the early success of DAOs such as FingerPrints, Flamingo, and PleasrDAO. 2022 will be a year of explosive growth for DAOs.
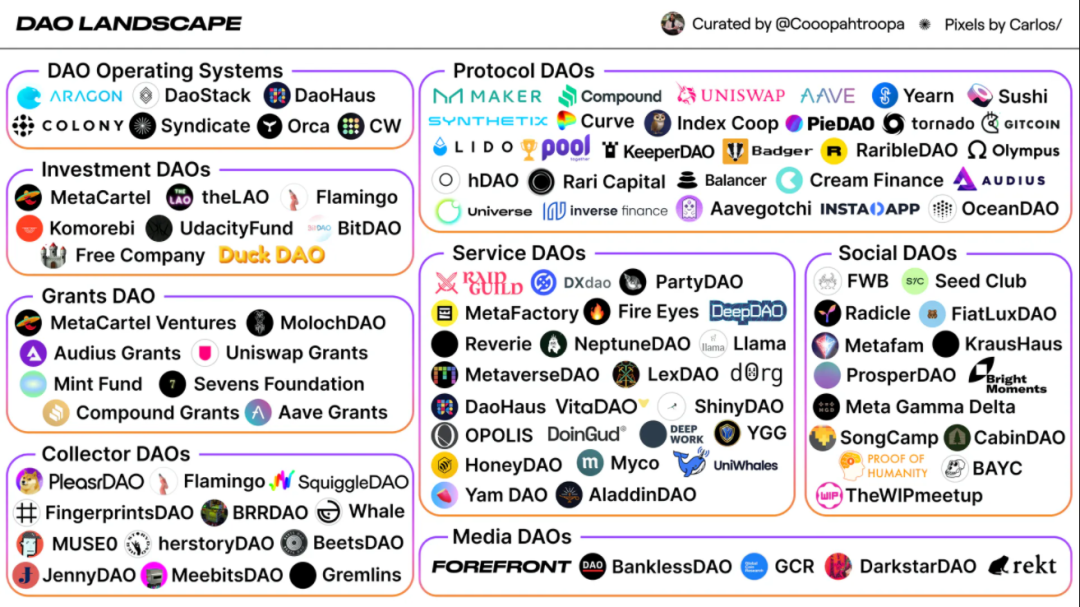
DAO market panorama, data source: Mirror, Coopahtroopa
Analysis of NFT data in 2021
We can peek at the attention of global netizens to the NFT ecology from the Google search volume of NFT. When using Google Trends to monitor the search volume of the keywords "NFT", "E**" and "Metaverse", we can see the trend in the figure below , from the beginning of 2021, the search volume of NFT began to increase. In February, there was an increase in search volume, and then continued to maintain popularity. In August, there was another increase in search volume. From October to December, the third time node has a larger search volume The increase in search volume was most pronounced between October and December. The number 100 on the left axis represents the highest point of relative search volume for the keyword on the graph for a given region and time. The search popularity of NFT is higher than that of E** and Metaverse, and it will reach its peak at the end of 2021. The search popularity of E** will be relatively stable throughout 2021, and Metaverse will have a significant increase around October 2021. Overall, 2021 2020 is indeed the first year of the outbreak of NFT, and the popularity continues to rise. Judging from the trend, the popularity of NFT will continue to increase in 2022.
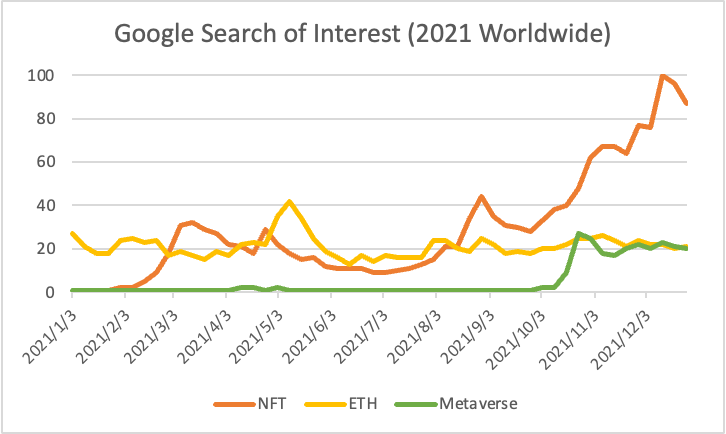
image description
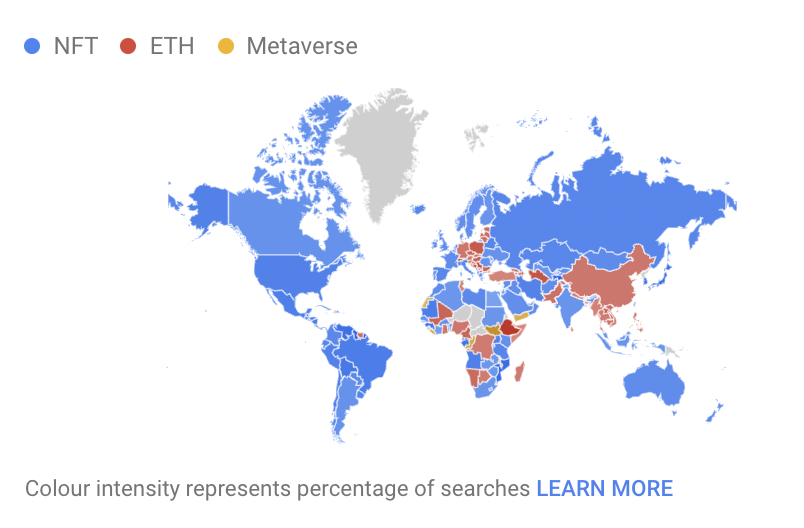
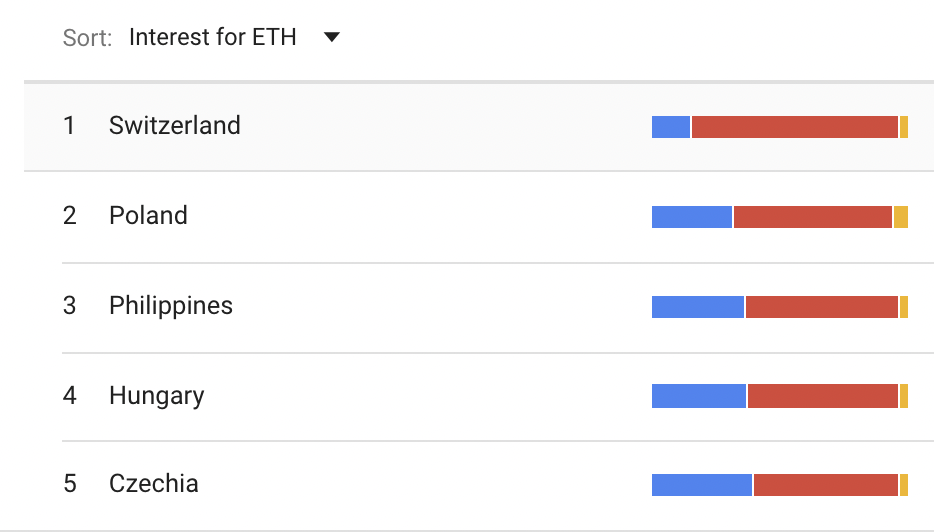
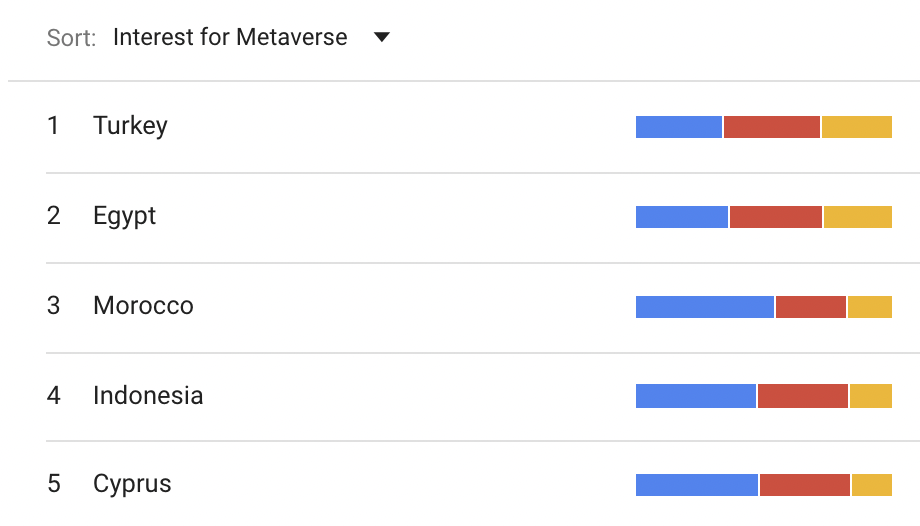
Regional Distribution of Google Search Interest for “NFT”, “ETH” and “Metaverse” – Worldwide Statistics for 2021
Data source: Google Trends, NFT Labs
It can be seen from the figure that the concepts of NFT and ETH are very popular all over the world except for a few regions.
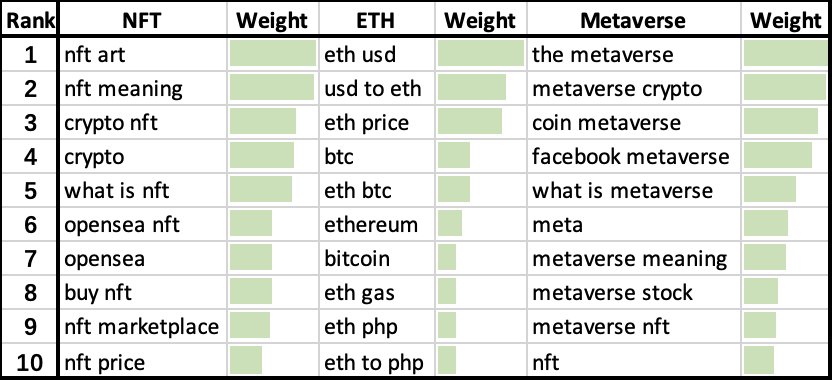
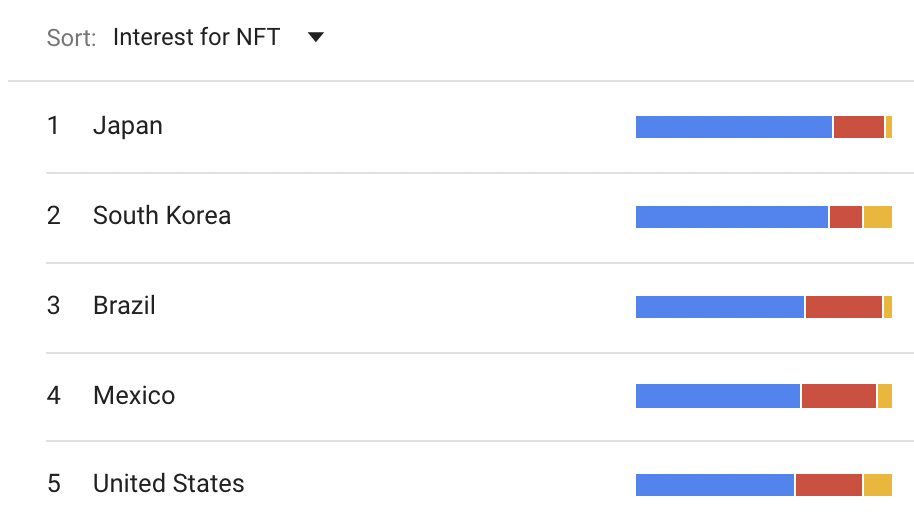
Top 10 Search Topics on Google for 'NFT', 'ETH' and 'Metaverse' – Worldwide Stats for 2021
image description
Data source: Google Trends, NFT LabsAn analysis of the top 10 topics and queries related to "NFT", "E**" and "Metaverse" shows that the most interesting topics related to NFT searches are the nature of NFT and how to trade NFT , which also proves the rapid popularity of NFT in 2021, attracting many newcomers who are willing to participate in the NFT ecosystem and conduct transactions. As the largest NFT trading platform, Opensea has a huge search volume. Among the related terms searched by E**, there are more comparisons with the US dollar fiat currency, and the search for Gas fee is not very high.image description
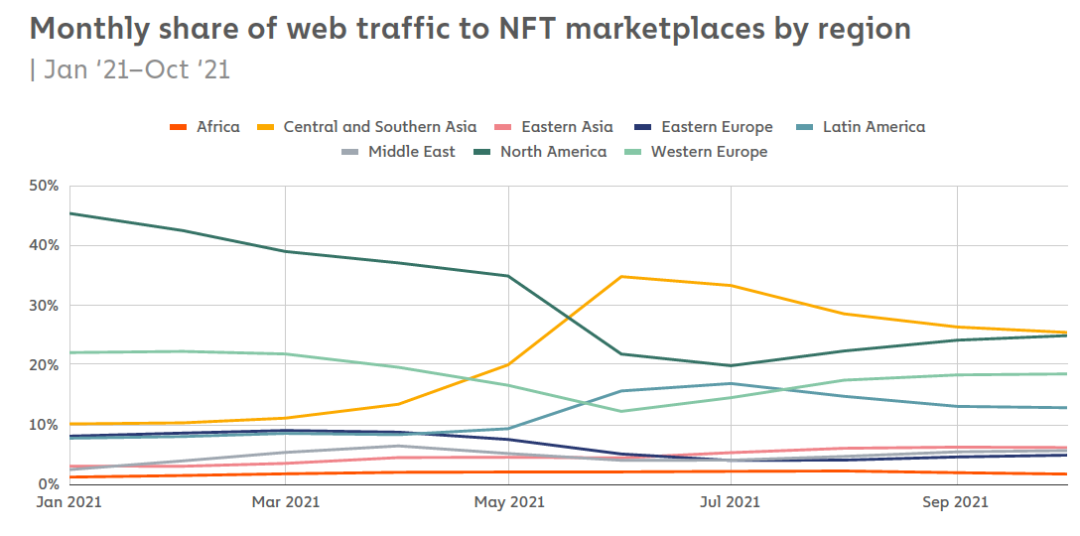
Monthly traffic share of NFT market by region (2021.1.21--2021.10.21)
image description
Data source: "The Chainalysis 2021 NFT Market Report"
As we can see from the chart, we see a strong mix of web access from multiple regions, with Central and Southern Asia, North America, Western Europe, and Latin America leading the way. This figure shows that, like traditional cryptocurrencies, NFTs have achieved global popularity, and no region has since accounted for more than 40% of monthly web visits.
image description
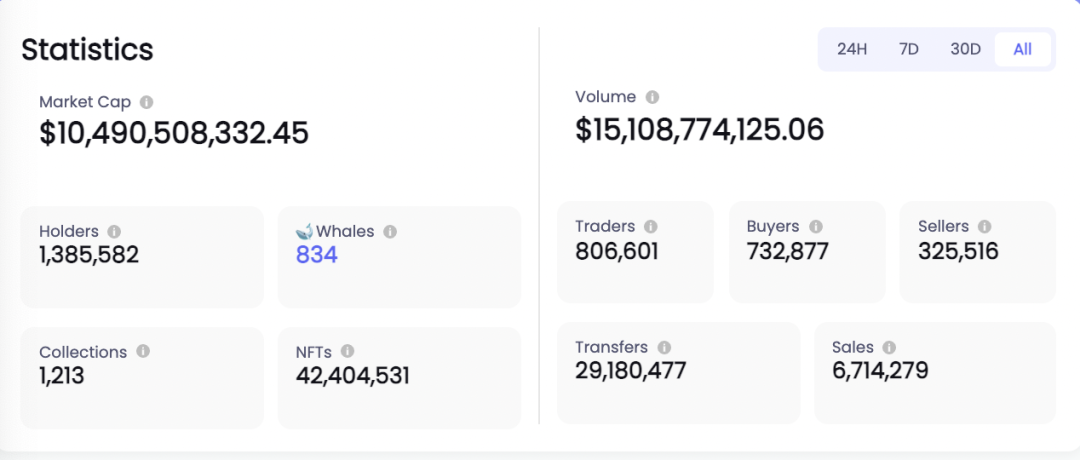
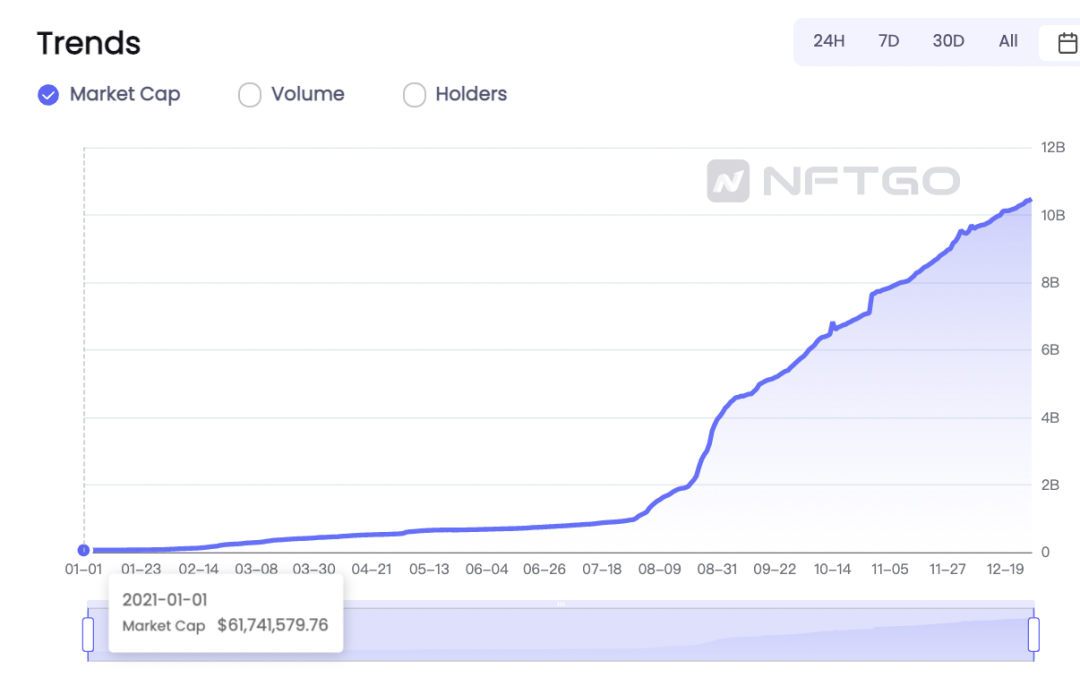
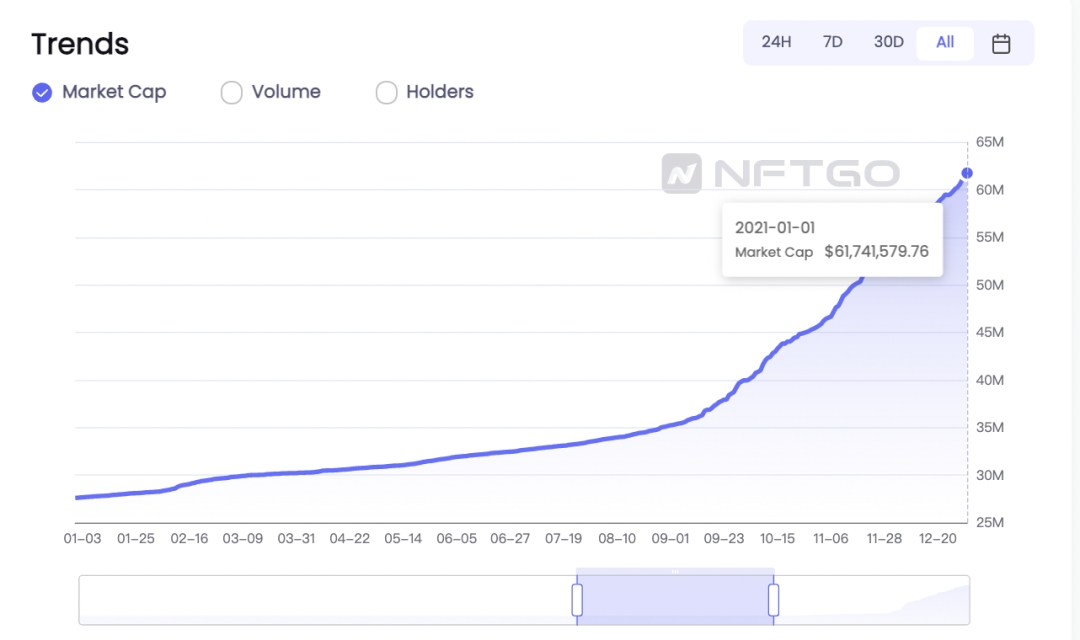
NFT market value (2021.1.1-2021.12.29) data source: nftgo.io
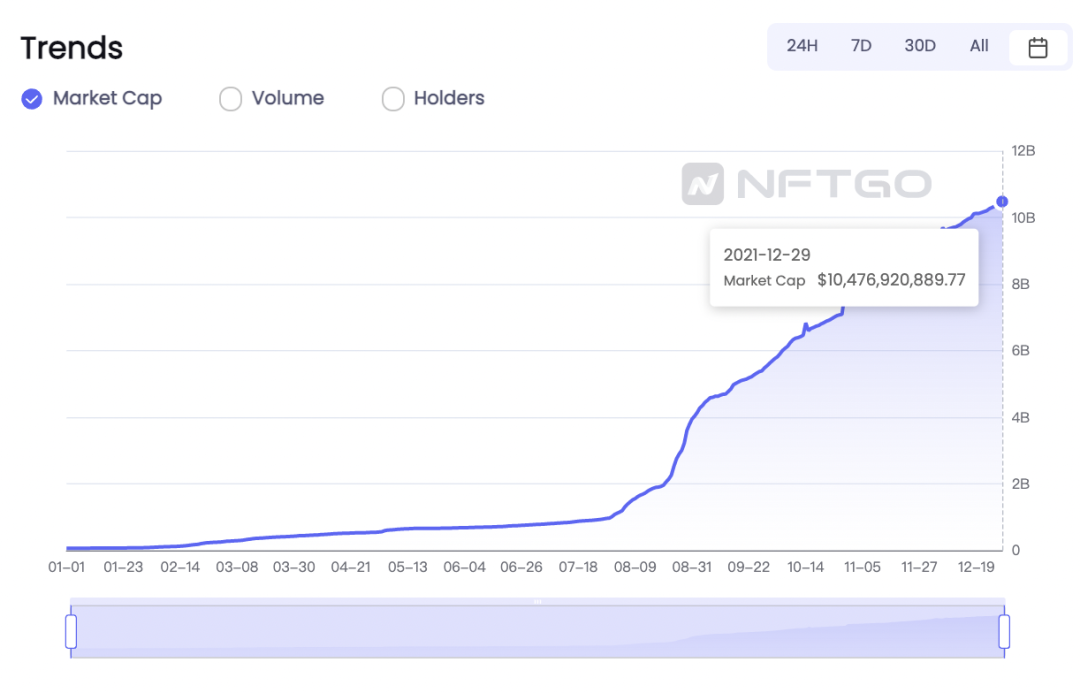
image description
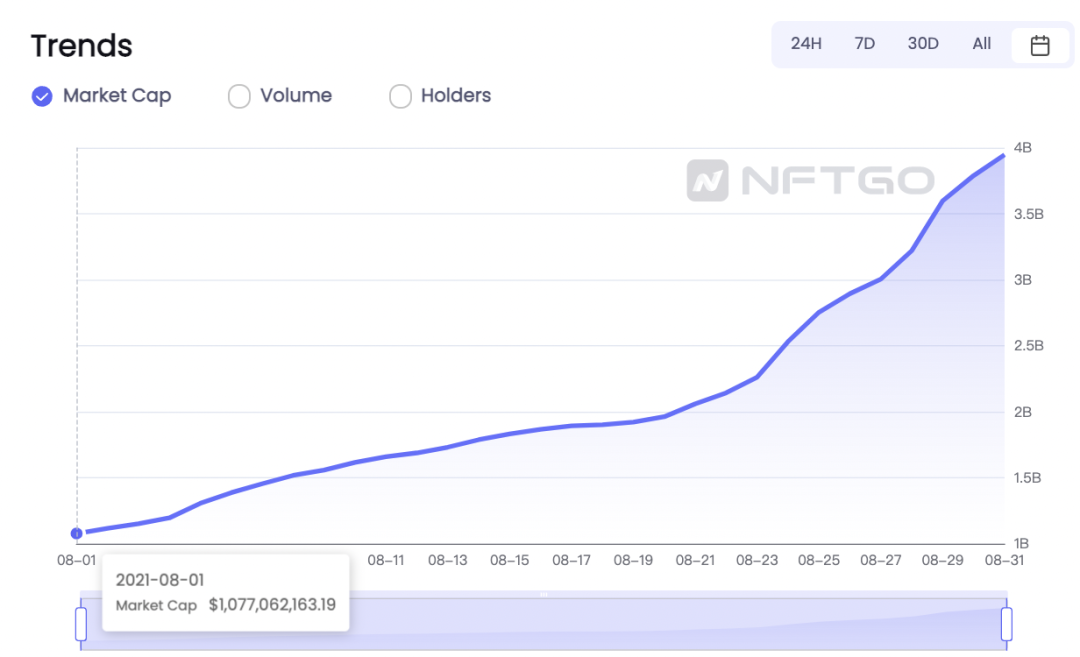
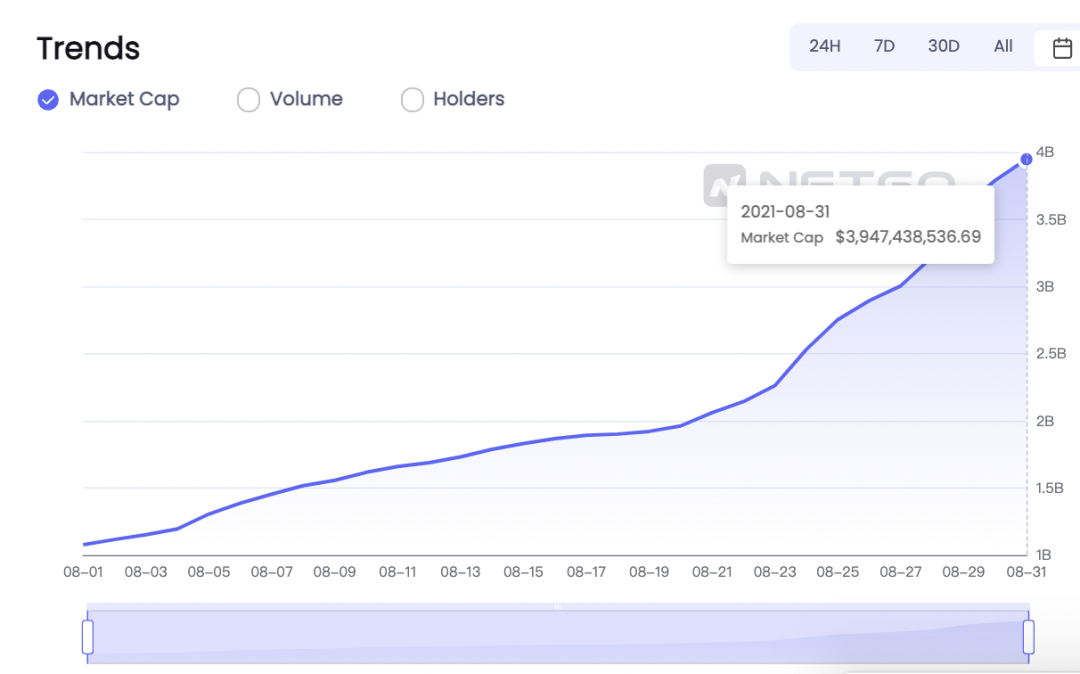
image description
In August 2021, the NFT market value growth curve is steep. On August 31, it was nearly 4 billion U.S. dollars, with a monthly growth rate of 400%, which shows how hot the NFT market is.
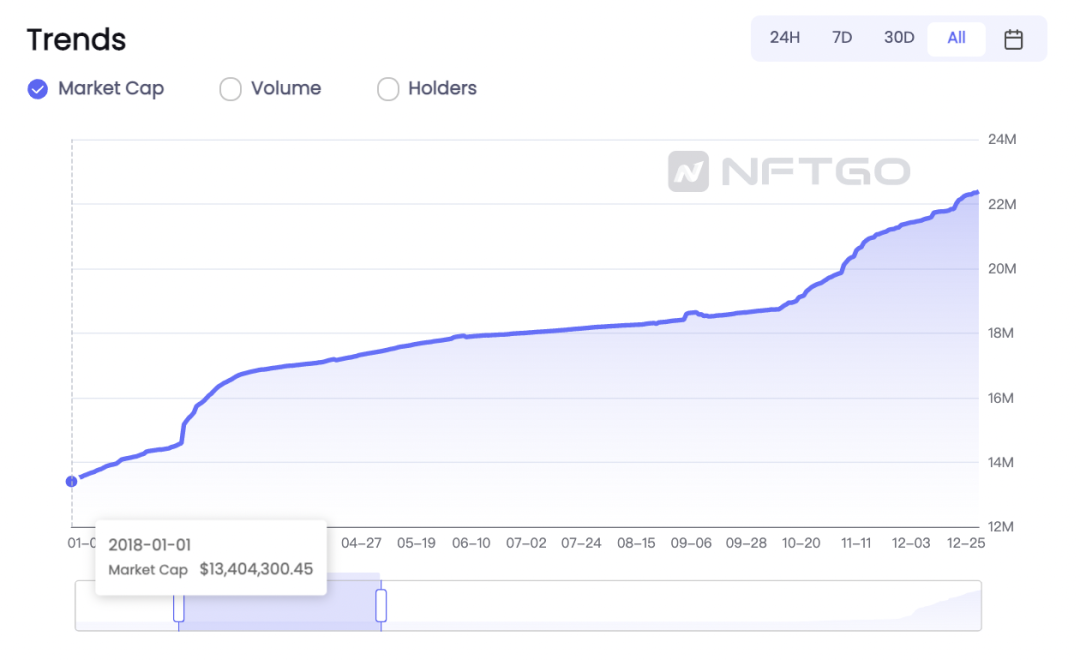
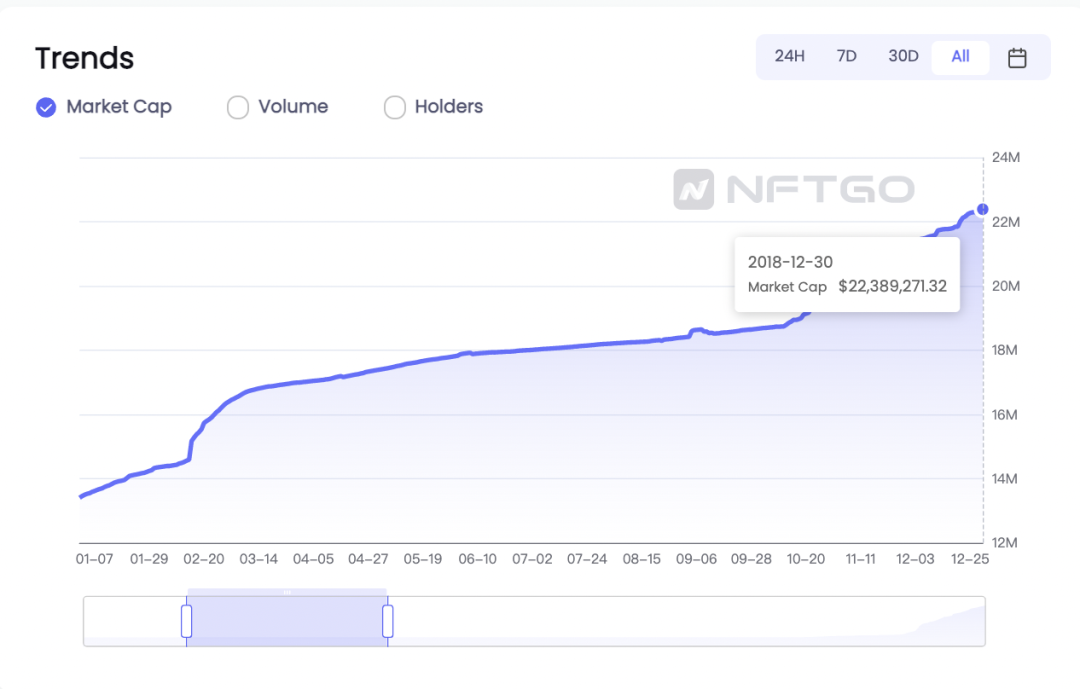
According to data from nftgo.io, from January 1, 2018 to December 30, 2018, the market value of NFT increased from US$13.4 million to US$22.39 million, an annual growth rate of 67%.
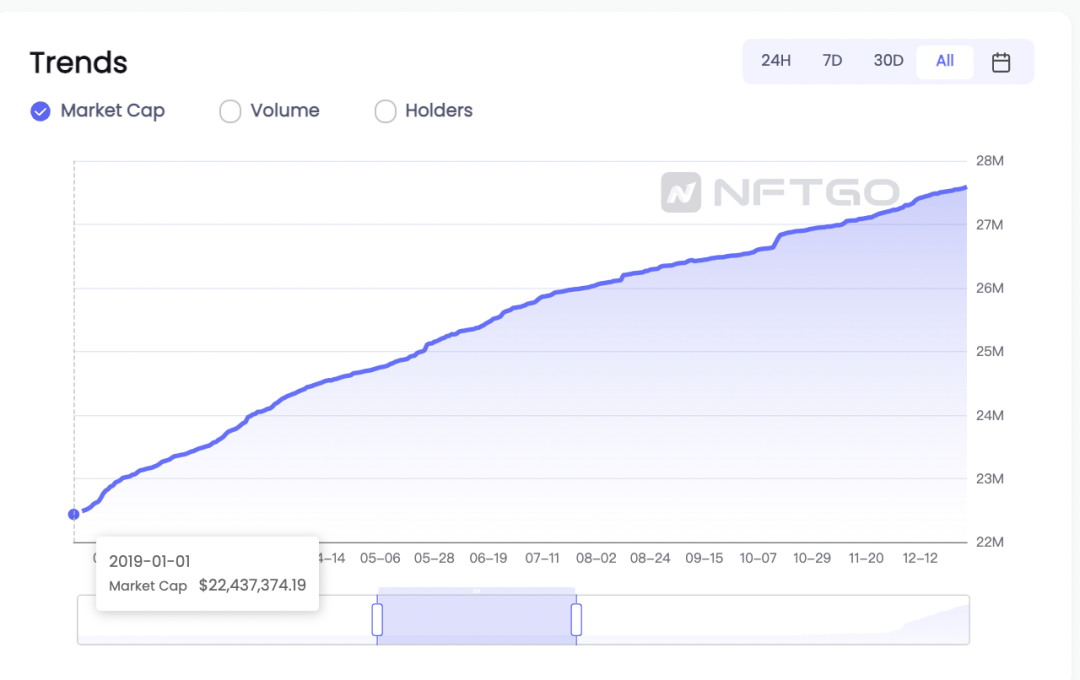
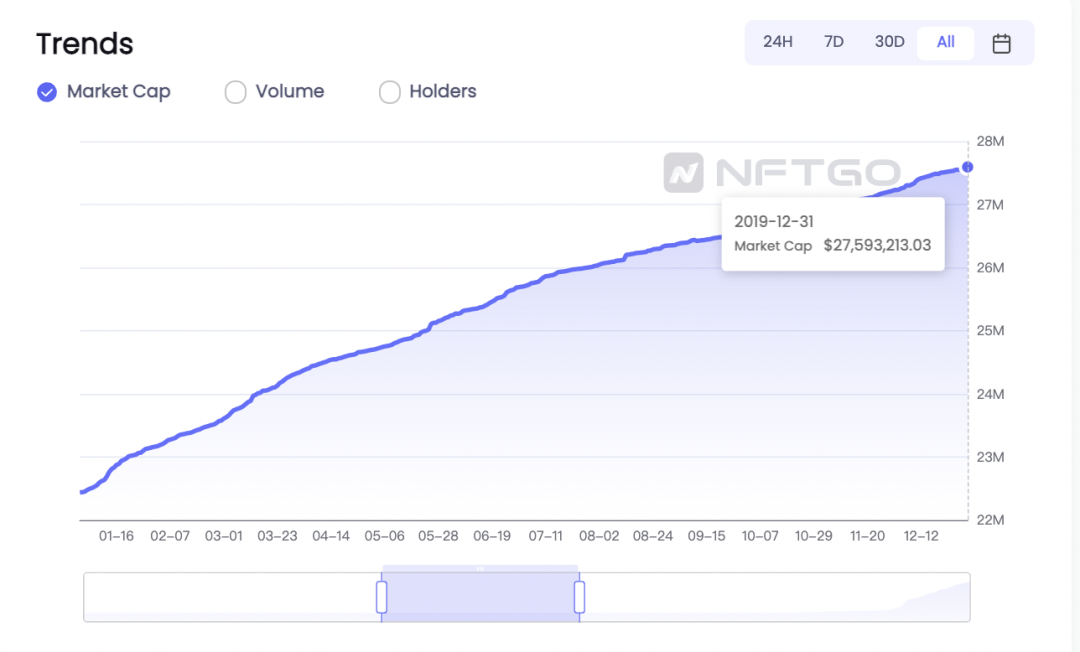
According to data from nftgo.io, from January 1, 2019 to December 31, 2019, the market value of NFT increased from US$22.44 million to US$27.59 million, with an annual growth rate of 23%.
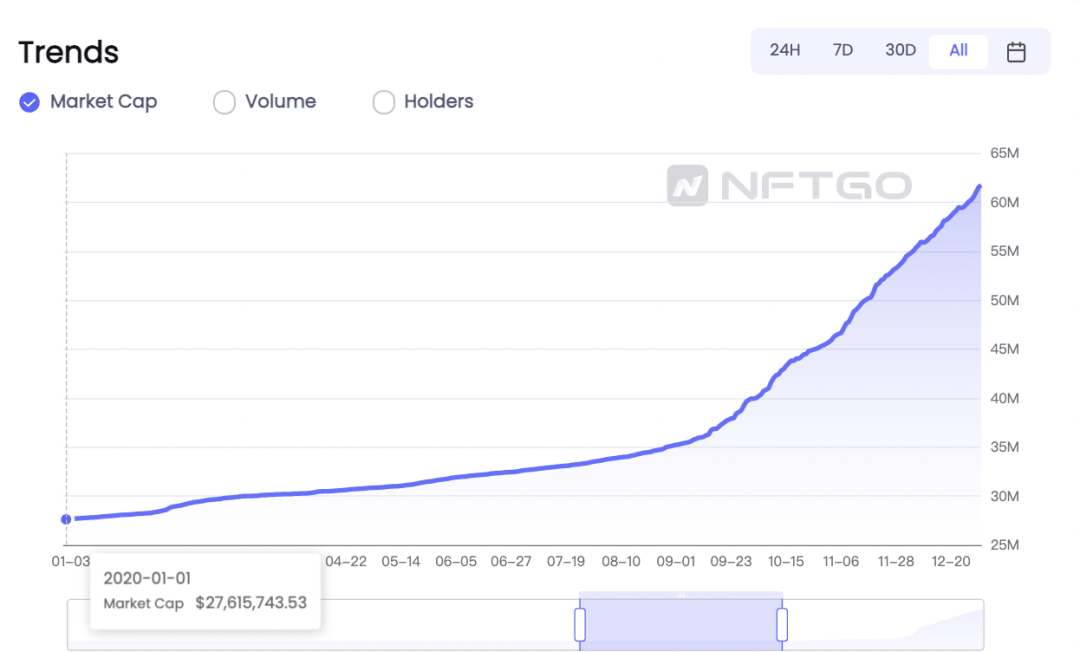
NFT market value (2020.1.1-2020.12.31) data source: nftgo.io
According to data from nftgo.io, from January 1, 2020 to January 11, 2021, the market value of NFT increased from US$27.62 million to US$61.74 million, an annual growth rate of 124%.
NFT trading volume soars - the highest daily trading volume is 570 million US dollars
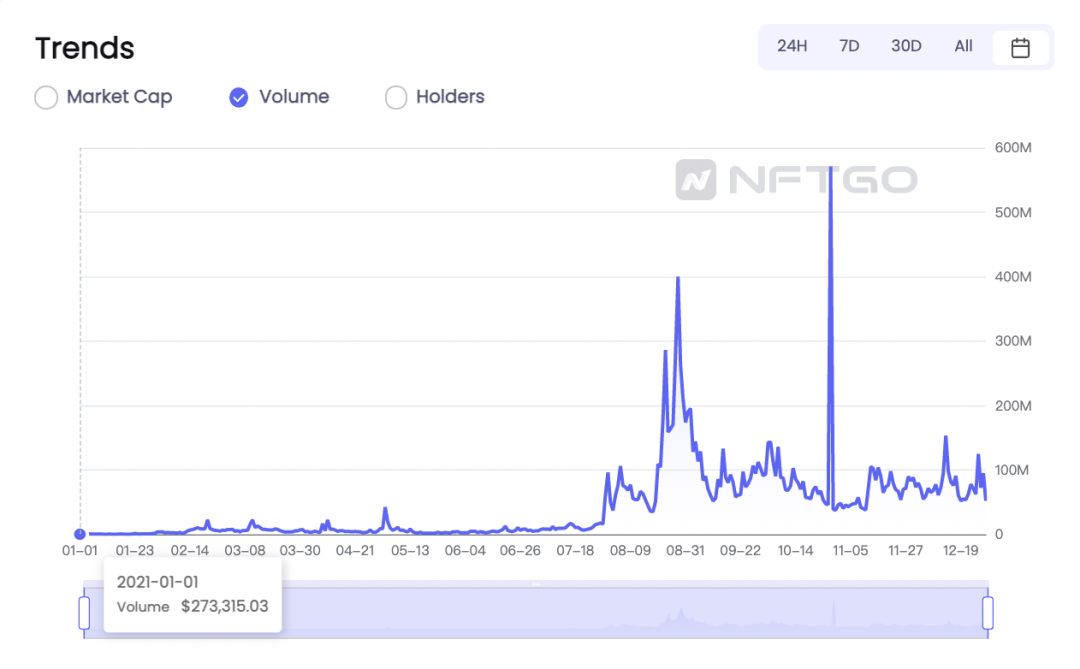
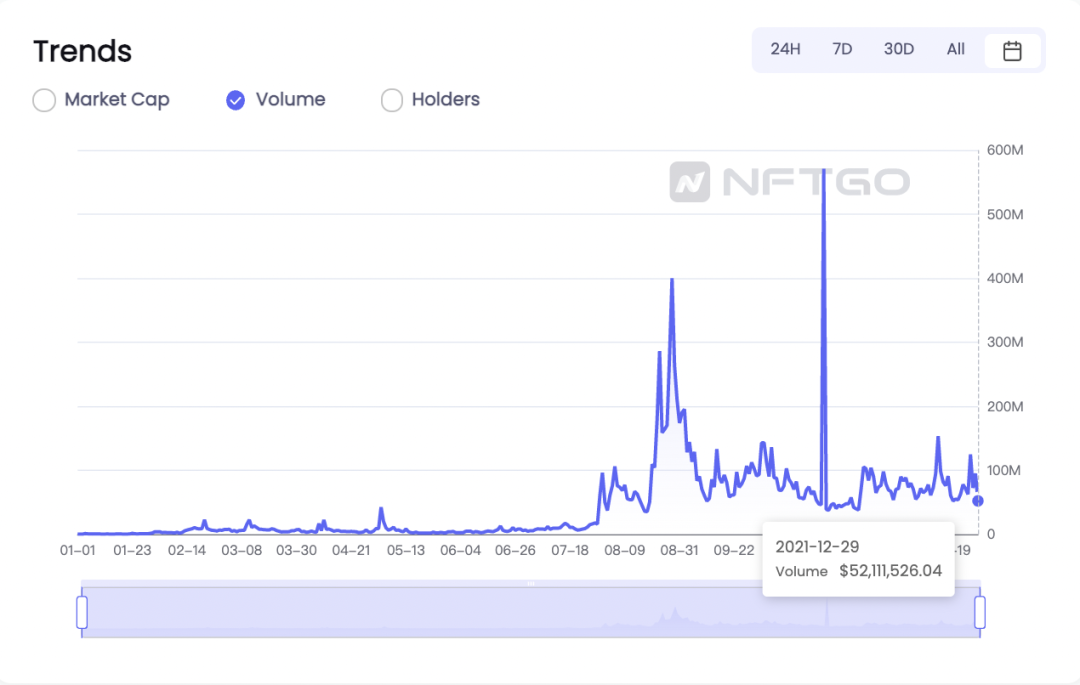
According to the data of nftgo.io, as of December 29, 2021, the daily trading volume of NFT has changed from 270,000 US dollars on January 1, 2021 to 52.11 million US dollars on December 29, 2021. The transaction volume in the first half of 2021 will stabilize, and the transaction volume in the second half of 2021 will fluctuate significantly.
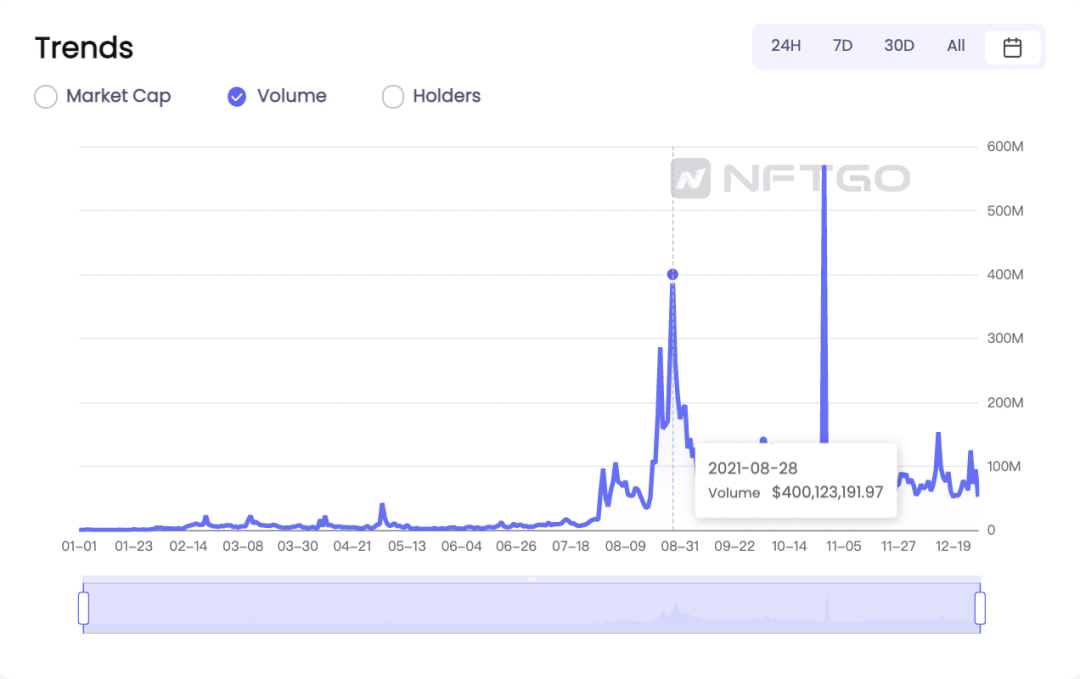
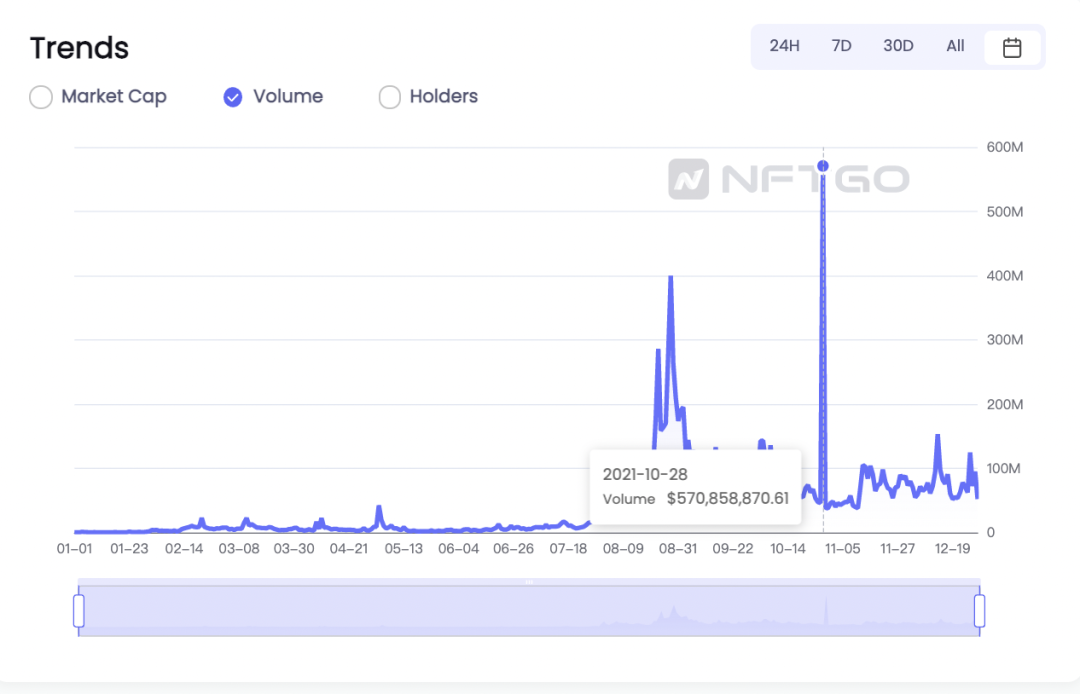
image description
NFT daily trading volume (2021.8.28 left, 2021.10.28 right) data source: nftgo.io
During August, the popularity of the NFT market reached its peak. According to data from OpenSea, the largest NFT trading platform, the peak of transactions was on August 29, when the transaction volume on that day exceeded 300 million US dollars. But since then, the activity has plummeted, and the turnover on September 8 has fallen below 100 million US dollars, a drop of nearly 70% from the highest point.
As the source of this round of NFT explosion, CryptoPunks has always been the vane of avatar NFT. On August 23, under the influence of the purchase of Visa and the entry of many bigwigs, there was a wave of FOMO, and 16,000 ethers were traded in just 4 hours. Less than a week later, the floor price of CryptoPunks was pushed up to 140 ETH, almost doubling.
The annual growth rate of the number of NFT holders exceeds 700%
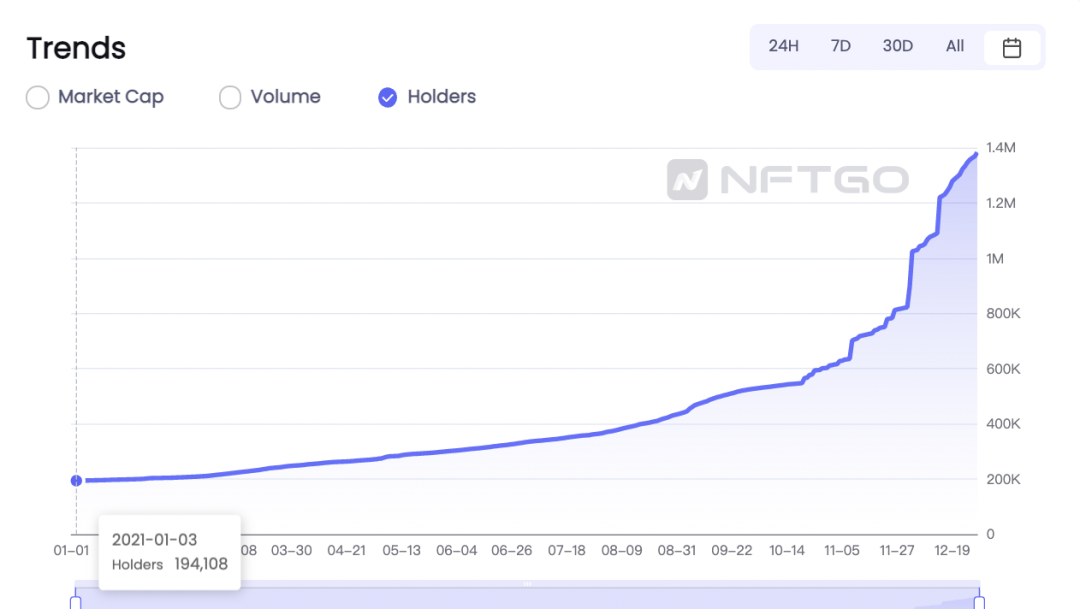
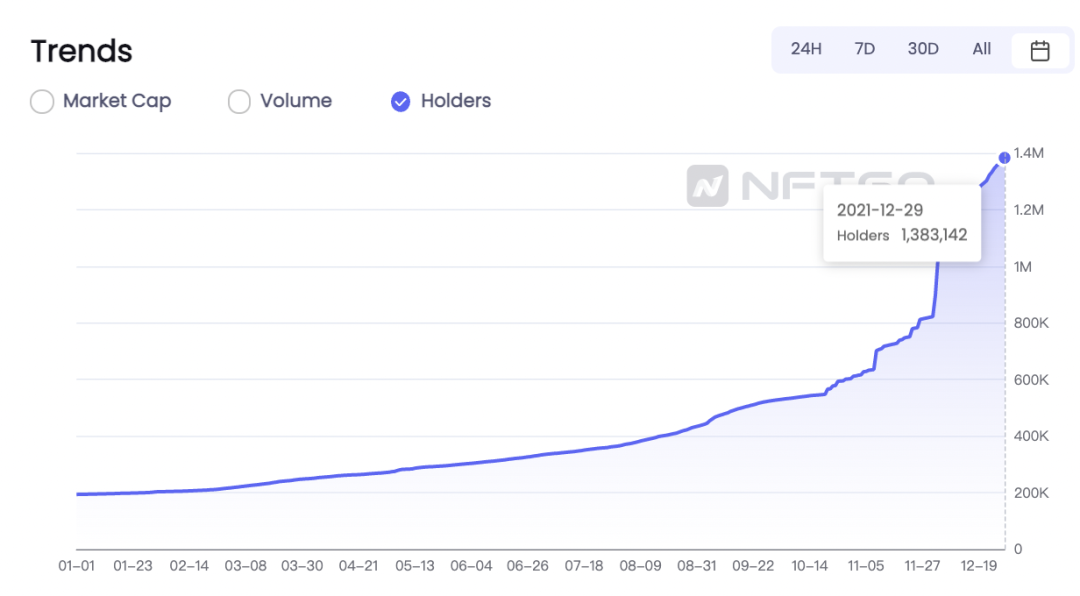
According to data from nftgo.io, as of December 29, 2021, the number of NFT holders has increased by 713% from 194,108 addresses on January 1, 2021 to 1,384,142 addresses on December 29, 2021 . The growth curve of NFT holders in the first three quarters of 2021 is smooth, and the number of new NFT holders in the fourth quarter of 2021 has increased significantly. There are three jump nodes for NFT holders in early November, late November and mid-December.
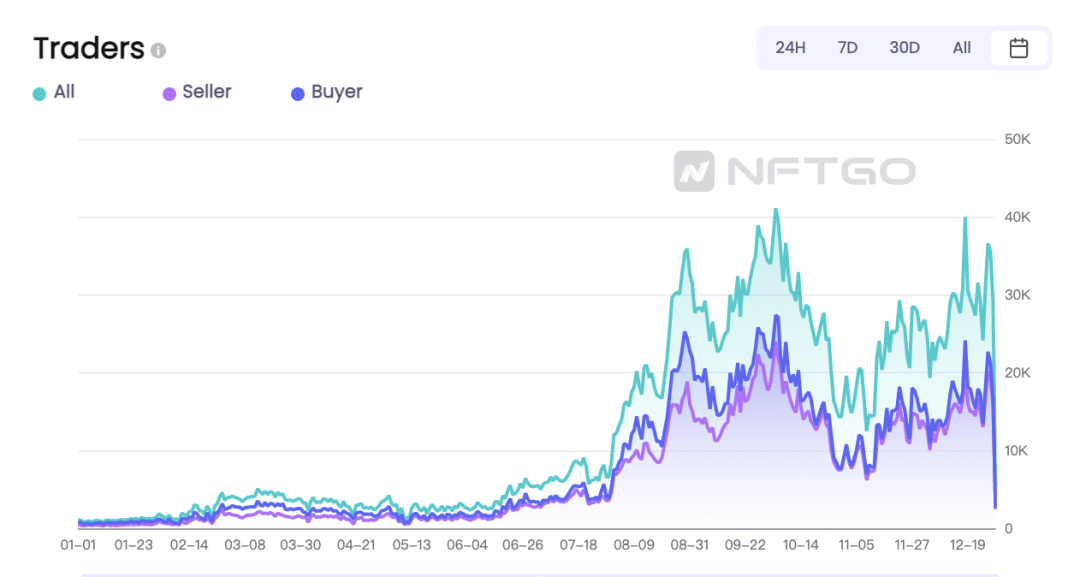
image description
Number of NFT traders (2021.1.1-2021.12.29) data source: nftgo.io
As of December 29, 2021, the number of NFT traders will grow steadily and slowly in the first half of 2021, and will show prosperity in the second half of 2021. Both sellers and buyers will increase sharply at the same time. Overall, there are more buyers than sellers.
The number of buyers and sellers represents a changing trend within the NFT ecosystem. If there are more buyers than sellers, it proves that there are more newcomers who want to enter this NFT ecosystem than newcomers who want to liquidate assets; conversely, if there are more sellers than buyers, it shows that people are selling assets. Therefore, a persistent gap between the number of buyers and sellers is a good indicator of the positive development of the ecosystem.
NFT investment and financing are hot
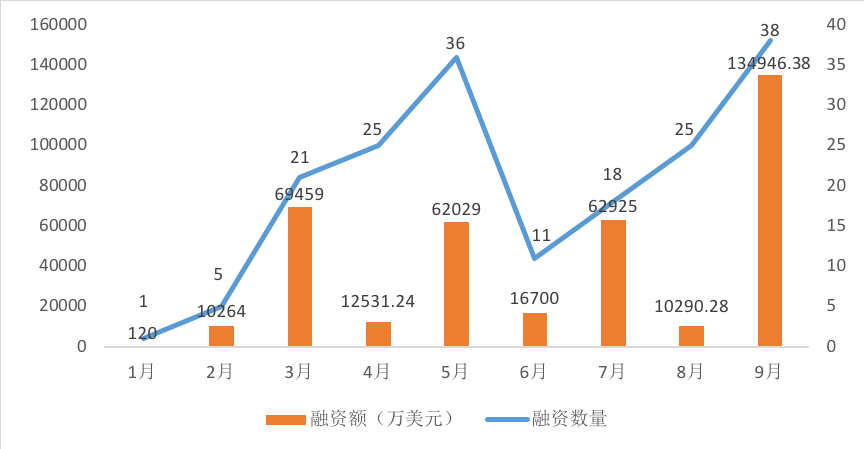
The number and amount of financing in NFT-related industries (January-September 2021) Data source: 01 Blockchain
Judging from the investment and financing data of the global NFT industry, from January to September 2021, the number of NFT investment and financing has declined significantly in June this year, and the rest of the months have maintained an upward trend. The number of financings in September reached a peak of 38. From the perspective of financing amount, the amount of NFT financing shows large fluctuations, and reached the highest value in September, close to 1.35 billion US dollars.
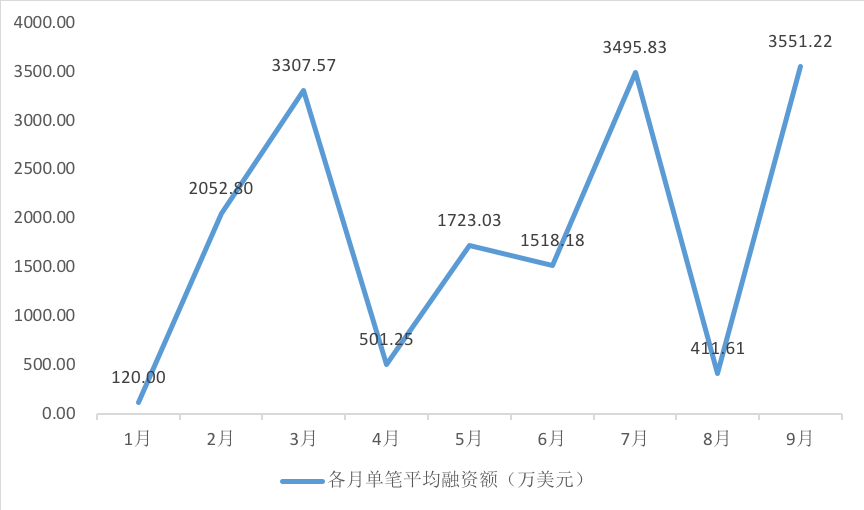
image description
According to the public financing amount projects, from the perspective of the average financing amount of a single project in a single month, the average financing amount in a single month in March, July and September is higher than that in other months. Among them, September has the highest financing amount, and the single project The average financing amount is still close to 35.5 million, which is the highest average financing amount in a single month this year.
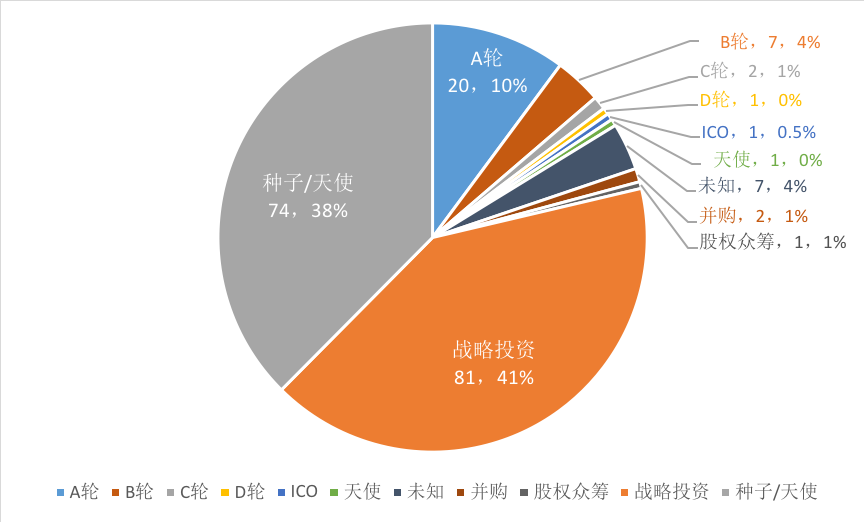
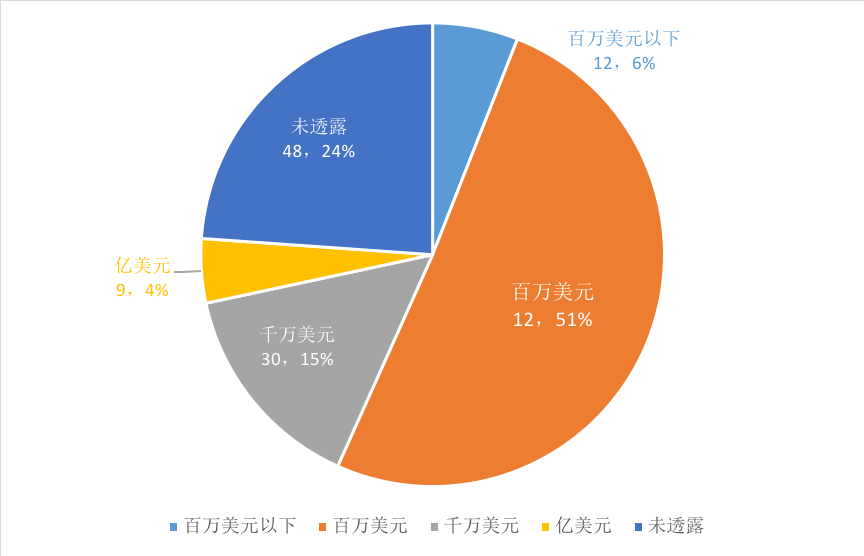
Distribution map of financing rounds of NFT-related industries (left) Distribution map of amount range (right) (January-September 2021) Data source: 01 Blockchain
From the perspective of financing rounds, strategic investment, seed/angel, and A round are the main financing methods for NFT-related industries, with 81, 74, and 20 cases respectively, accounting for 41%, 38%, and 10%. In addition, there were 7 cases in the B round, 2 cases in the C round and mergers and acquisitions, and 1 case in the D round, ICO, and equity crowdfunding. 51% of the invested projects had a financing amount between US$1 million and US$10 million, and there were 30 and 9 financing events at the level of tens of millions of US dollars and hundreds of millions of US dollars, accounting for 15% and 4% of the total.
NFT application scenarios in 2021
The new NFT project is not only the future of merchandising, but also provides musicians with new ways to protect copyright in the era of streaming media and digital content sharing, and creates new economic profit methods for game developers. Although NFT was originally applied to art collections, due to its uniqueness and value, NFT has developed into a way for some people to display their wealth and identity by owning NFT. In the future, NFT as a digital collection will also be more widely used in the DeFi field, gradually expanding from art investment to a wider range of rare collections, real estate, loan collateral and other fields.
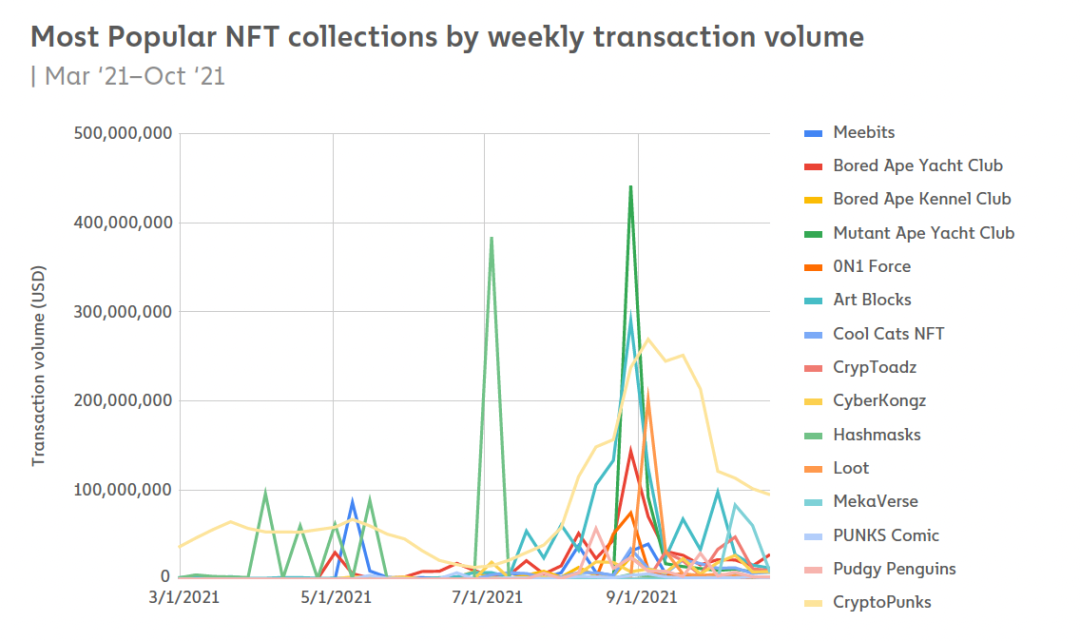
Weekly trading volume of the most popular NFT series (2021.3--2021.10)
image description
Data source: "The Chainalysis 2021 NFT Market Report"
We can also see from the chart that some new projects such as Hashmasks had a transaction volume of $380 million in the week of July 4, 2021, but the enthusiasm only lasted for a short period. A similar pattern can also be seen in the weekly trading volume in the Mutant Ape Yacht Club. The huge exposure and popularity at the beginning cooled down very quickly.
first level title
Bored Ape Yacht Club
In early May 2021, Bored Ape Yacht Club (BAYC) was born. The full name of BYAC is Bored Ape Yacht Club. It is a collection of 10,000 ape NFTs, including 170 attributes of different rarities such as hats, eyes, demeanor, clothing, and backgrounds. 10,000 unique apes were randomly combined through programming, and each ape had a different expression and dress. BAYC can definitely be said to be the best-performing NFT series in 2021. Whether it is price increase, popularity, social capital, etc., BAYC has led a collection of NFT avatars to previously unimaginable heights.
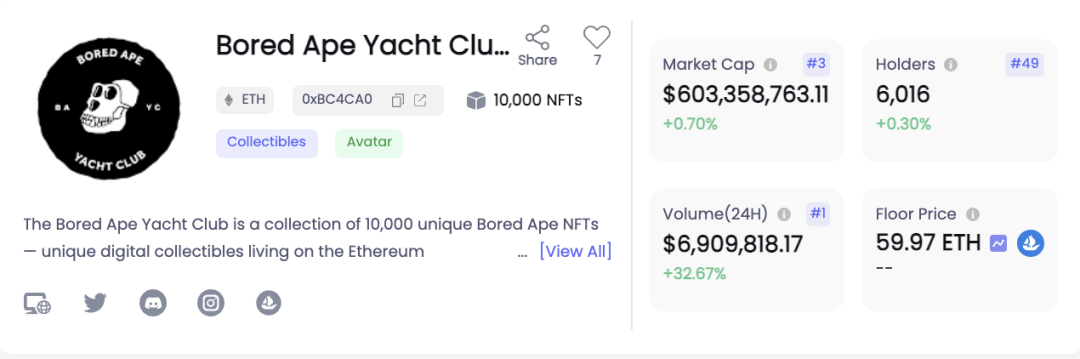
Bored Ape Yacht Club (BAYC) market capitalization, number of holders, 24-hour trading volume and floor price data, data source: nftgo.io
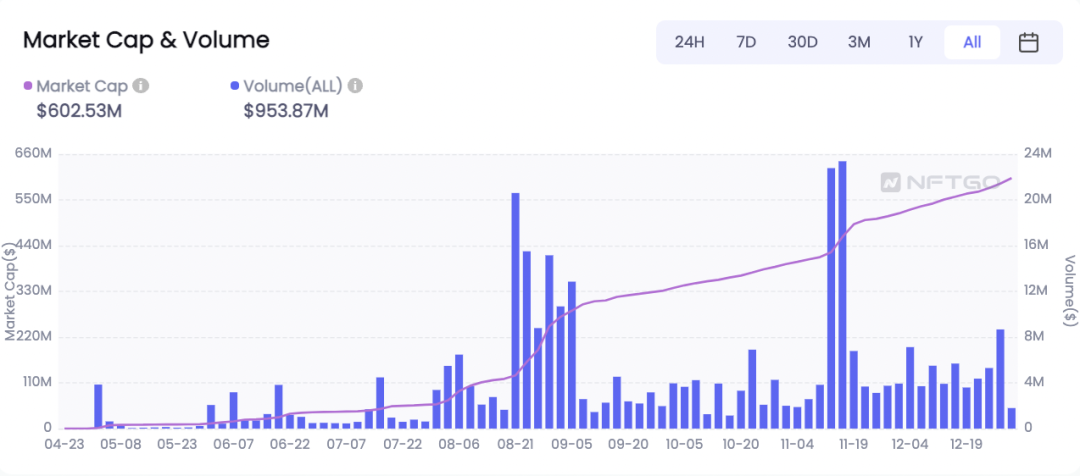
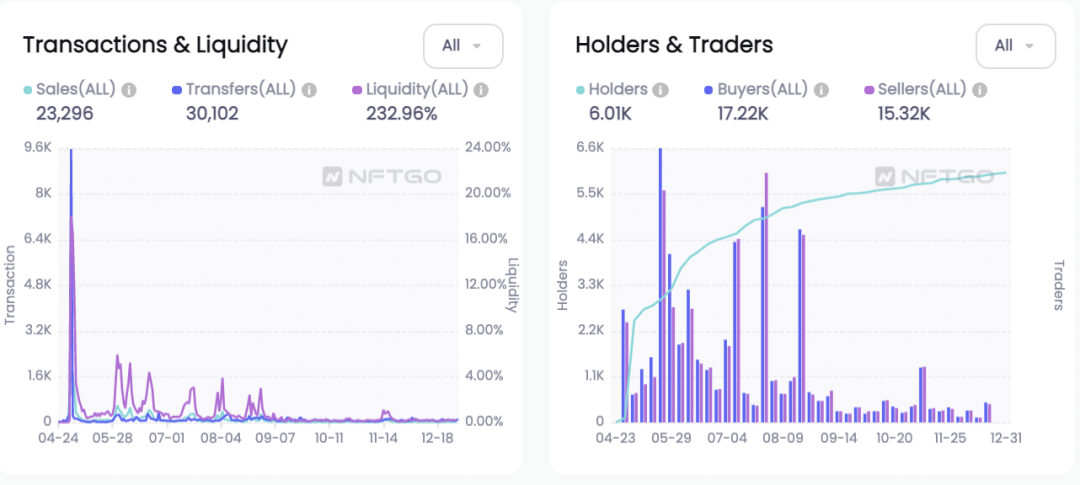
As of December 29, 2021, the total market value of Bored Ape Yacht Club (BAYC) is close to 600 million US dollars, with a total of 6002 holders. The transaction volume in the past 24 hours is 9.8 million US dollars, and the floor price is 58.5ETH. Unlike Hashmasks, which was extremely popular but quickly fell from the altar, BAYC's popularity continues to hit new highs, and its market value and transaction volume are on the rise. The liquidity since its release is 232.47%, (liquidity is an indicator used to reflect the relative liquidity of assets. Liquidity = trading volume / total supply of NFT * 100%) is much higher than Hashmasks, and holders and Hashmasks The quantity is in the range of 5000-6000.
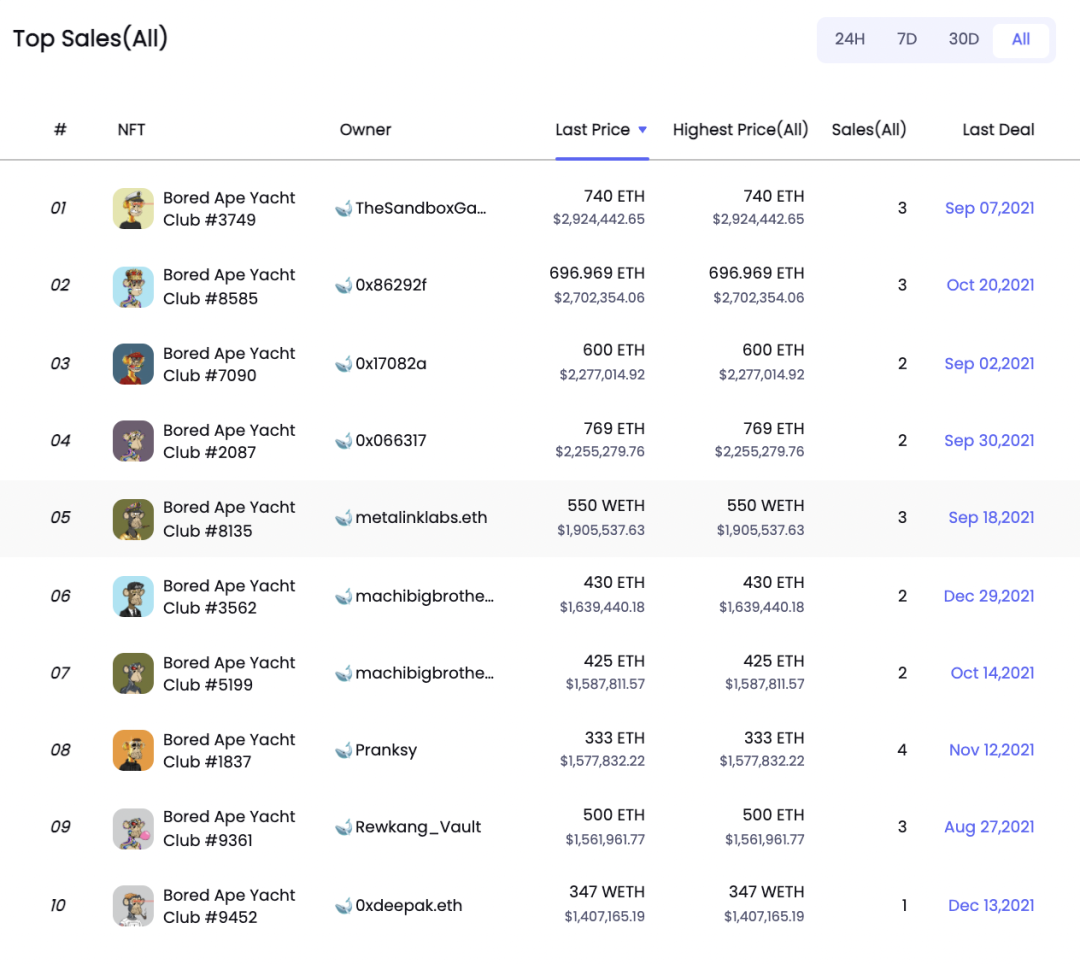
image description
Bored Ape Yacht Club (BAYC) top ten transaction records (2021.4.23--2021.12.30), data source: nftgo.io
Loot (for Adventurers)
As of December 30, 2021, the NFT work with the highest transaction price of Bored Ape Yacht Club (BAYC) is "Bored Ape Yacht Club #3749".
The reason why Loot can get huge attention is that it has changed the way of creating NFT digital avatars. People have changed from passively accepting digital avatars created by the project party to digital avatars created by the community. In other words, NFT used to be an existing product. There is a community, and now Loot proposes a new paradigm for the existing community to co-create NFT products, which is more in line with the decentralized core of the blockchain.
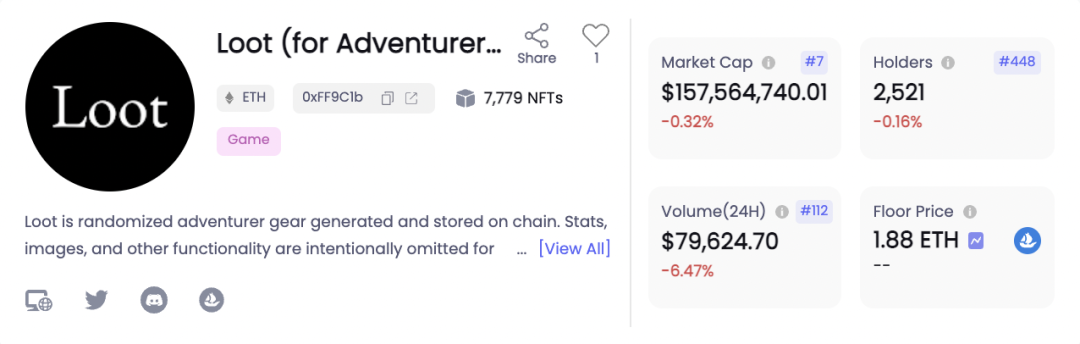
- Loot (for Adventurers) market capitalization, number of holders, 24-hour trading volume and floor price data, data source: nftgo.io
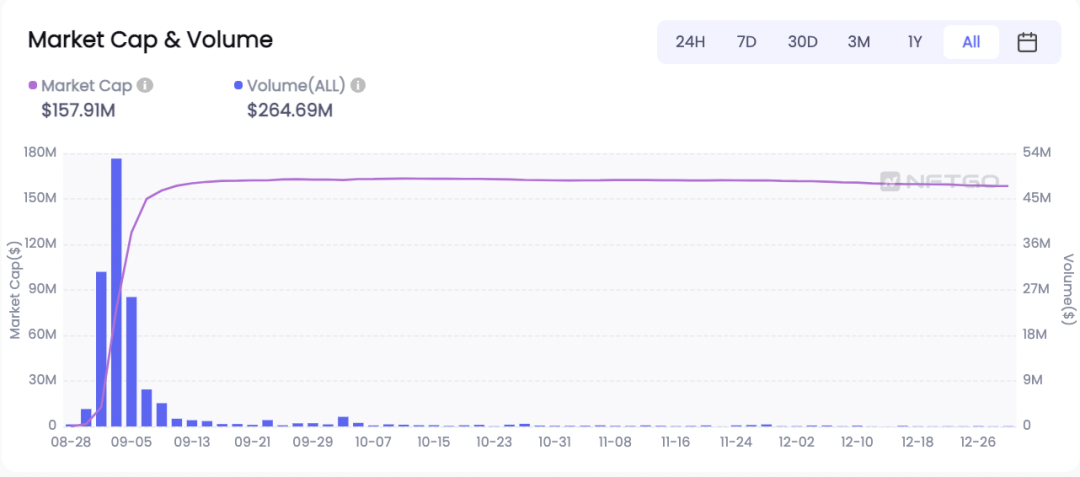
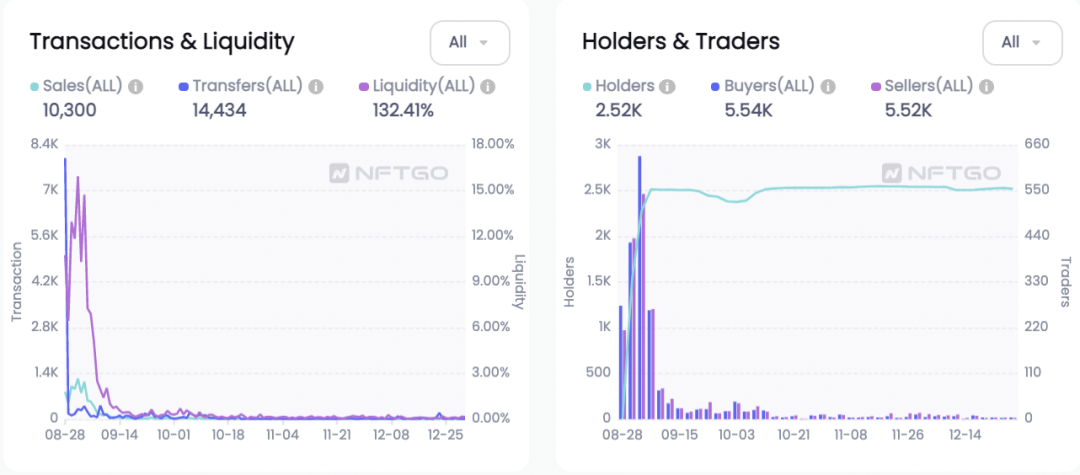
- Loot (for Adventurers) trading volume & liquidity (left picture) Loot (for Adventurers) holder & trader change curve (right picture) (2021.8.27--2021.12.30), data source: nftgo. io-
The overall liquidity is good, and the transaction volume reached its peak when the project was just launched. Since Loot lacks a way to capture follow-up value, the current performance of the secondary market is not as good as expected, and the transaction volume is sluggish.
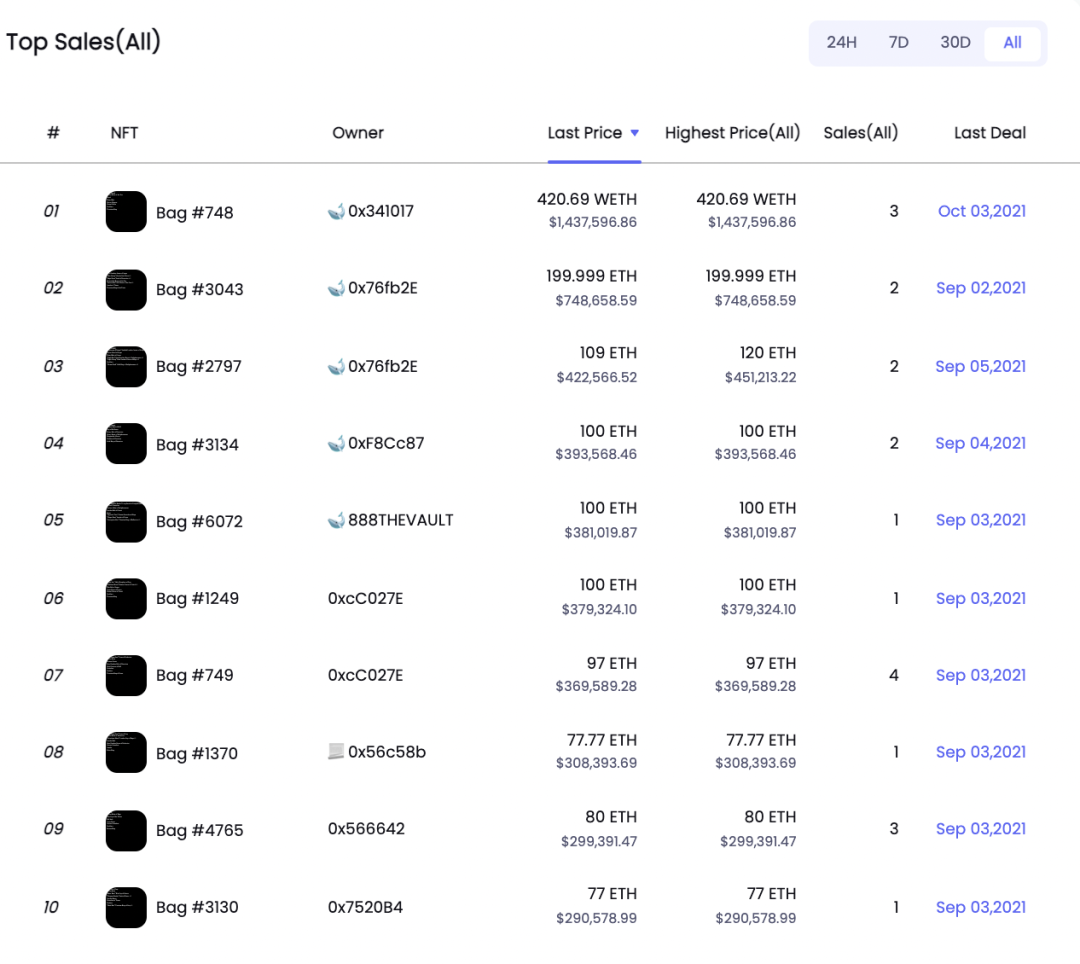
As of December 30, 2021, the NFT work with the highest transaction price of Loot (for Adventurers) is "Bag #748", and the latest transaction was at 420.69ETH on October 3, 2021 (approximately US$1,437,597).
CryptoPunks
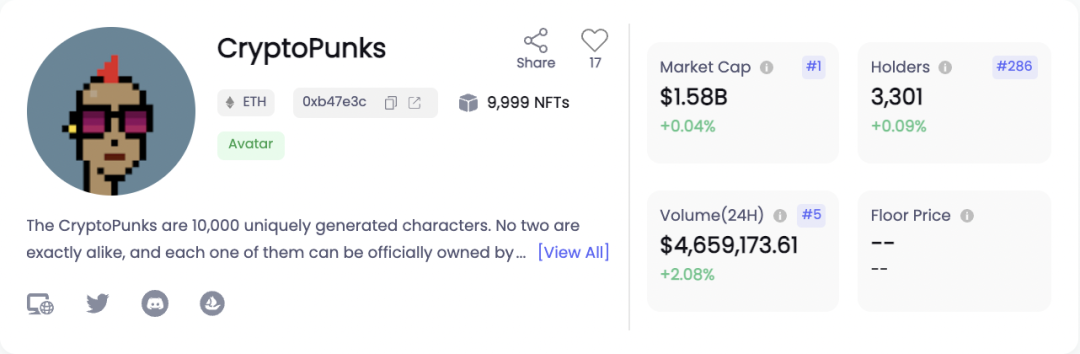
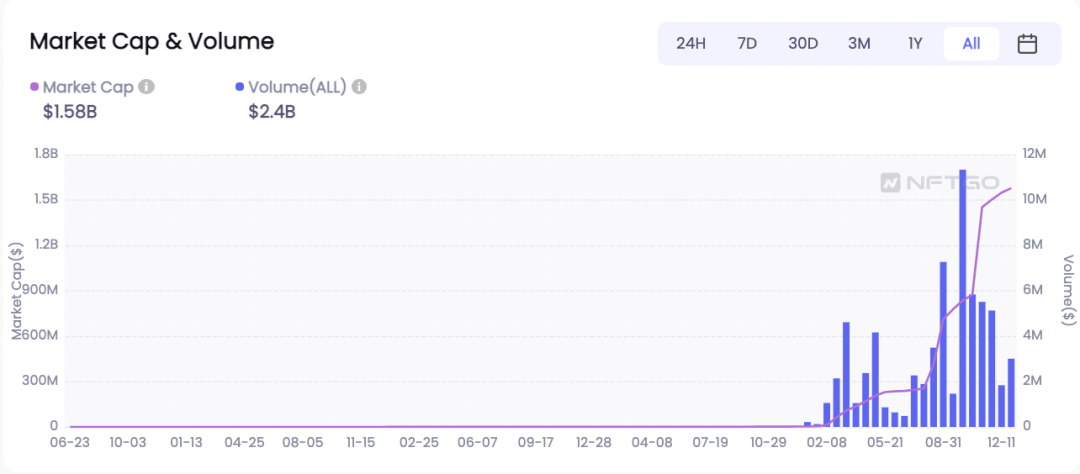
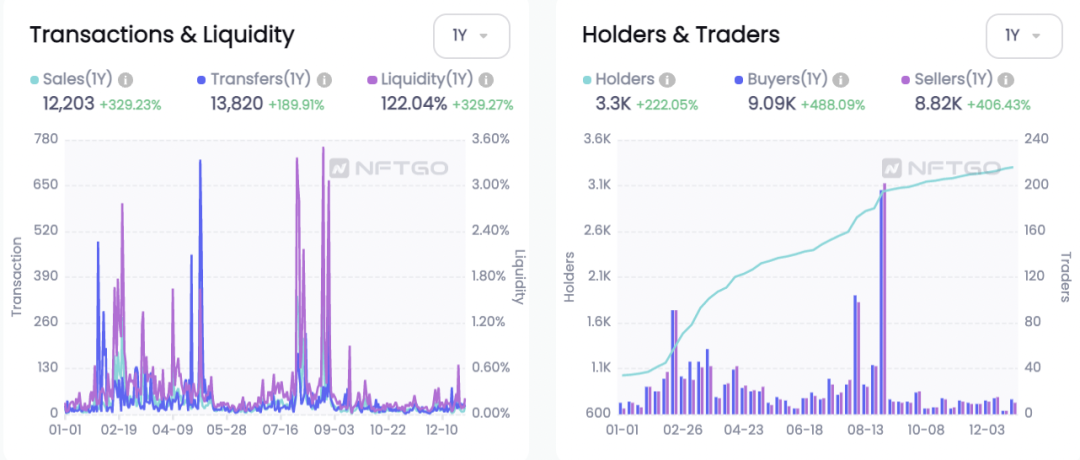
- CryptoPunks trading volume & liquidity (left picture) CryptoPunks holder & trader change curve (right picture) (2021.1.1--2021.12.28), data source: nftgo.io -
As of December 30, 2021, the total market value of CryptoPunks is close to 1.58 billion US dollars, with a total of 3301 holders, and the transaction volume in the past 24 hours is 4.66 million US dollars. The popularity of CryptoPunks can be seen from the real change curve. 2021 is the year when CryptoPunks will explode, and the popularity of 2021 will not decrease throughout the year. Nowadays, the entry threshold of CryptoPunks is relatively high, but the speculation in the market is not serious, the liquidity is good, and the willingness to hold for a long time is strong.
text
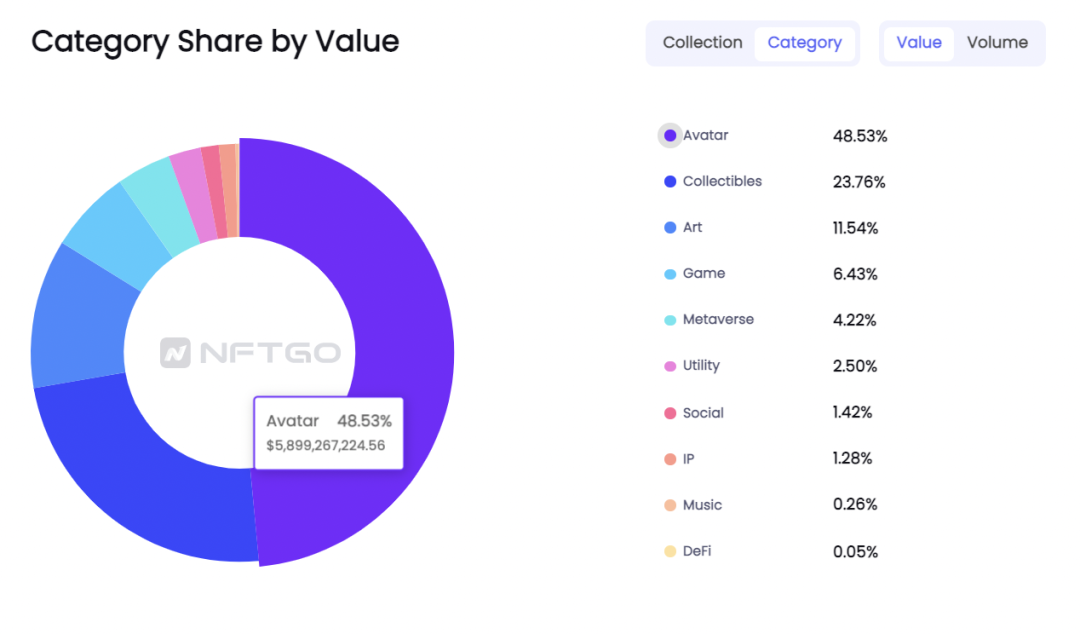
Avatar (avatar/virtual avatar) is leading the way, accounting for about half of the market value of the NFT market, with a total of nearly 6 billion US dollars. Collectibles (series combinations) followed closely behind, and the market value of NFT in the first three categories accounted for more than 80%.
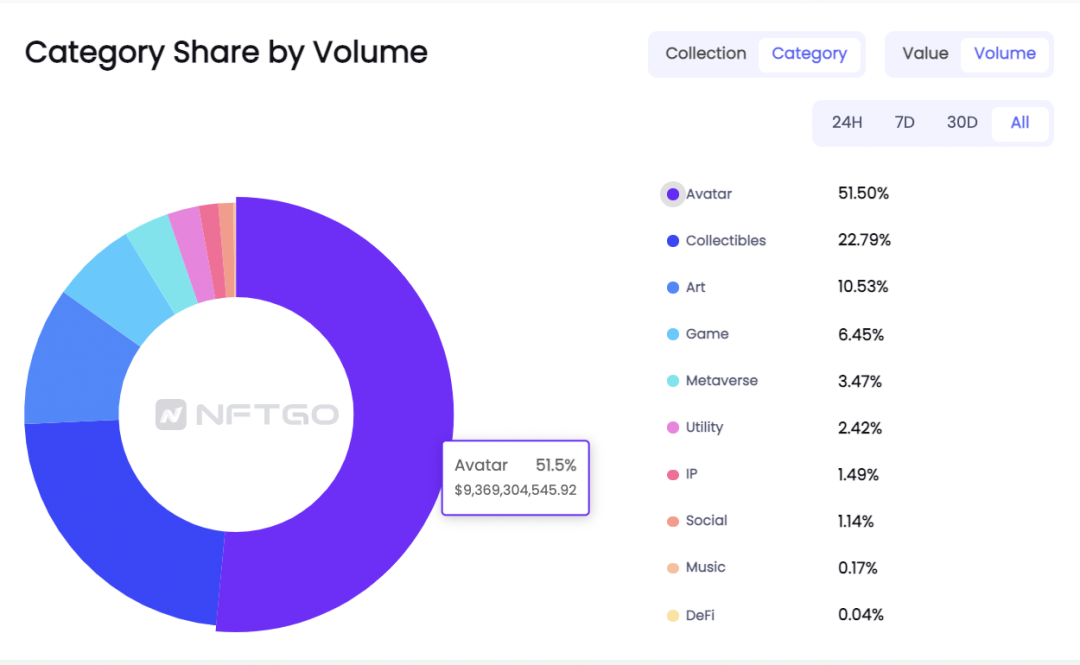
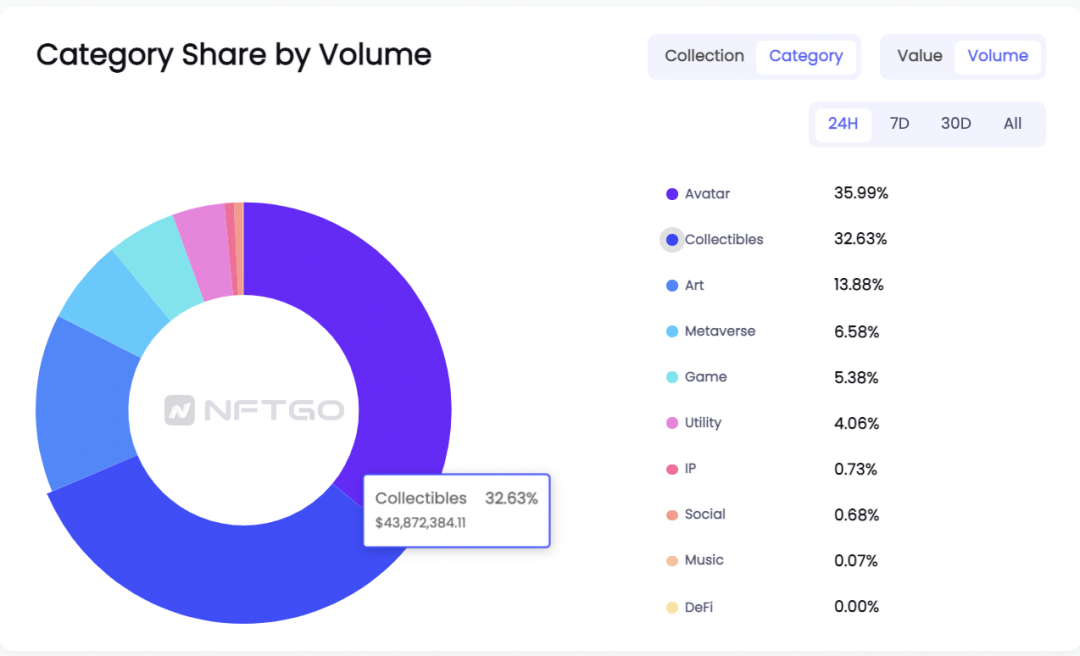
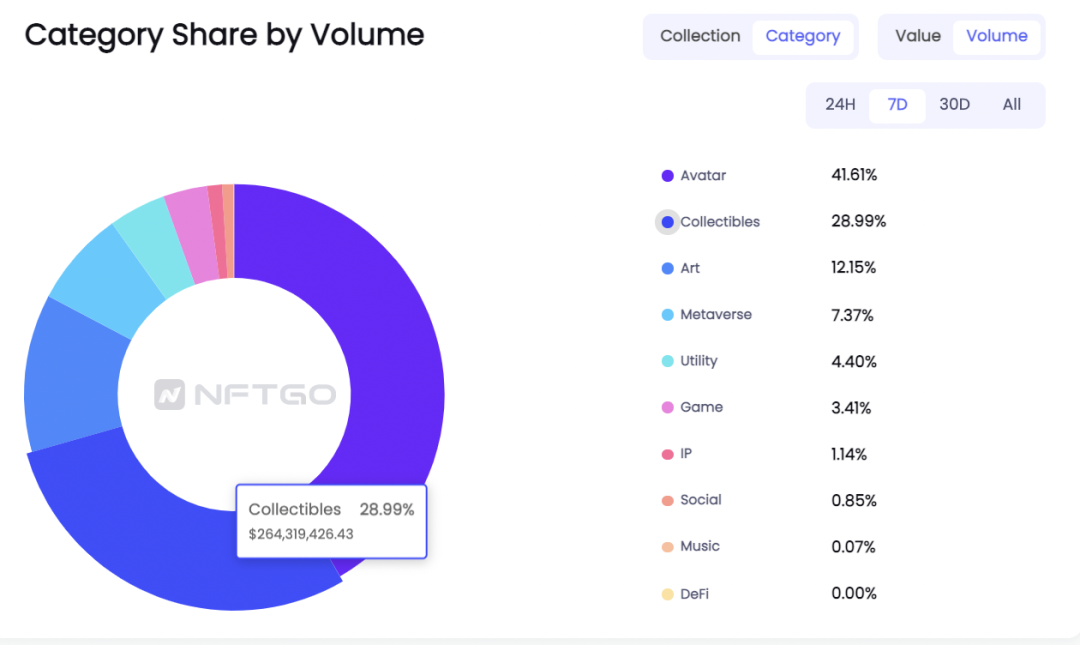
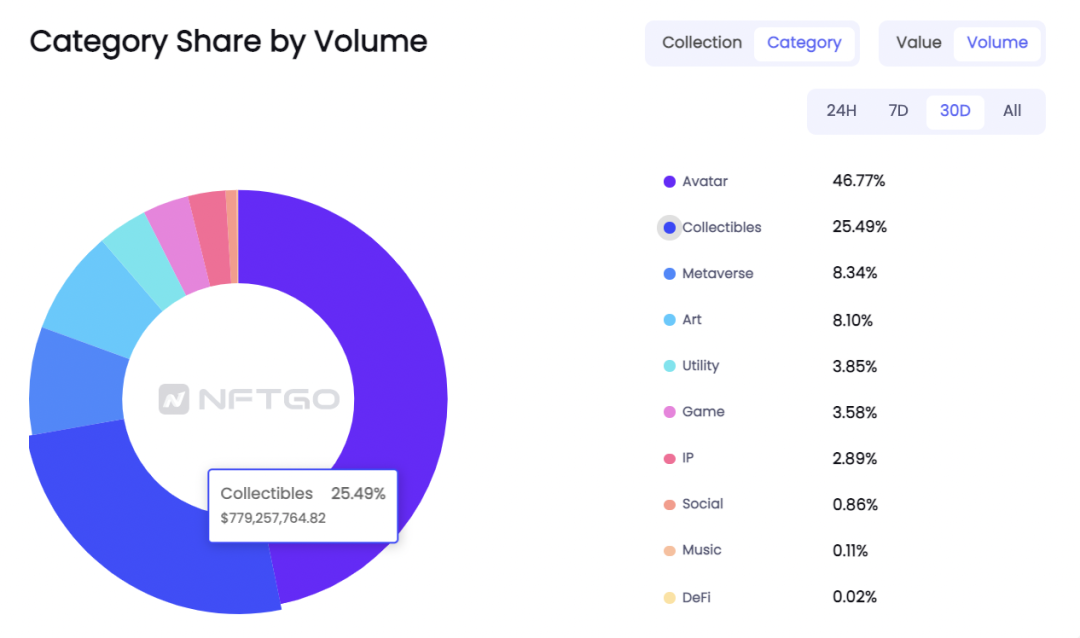
Different types of NFT transaction volume distribution data and market value distribution confirm each other. The larger the market value, the greater the transaction volume. However, from the 24H/7D/30D data, the transaction volume of Avatar (head portrait/virtual avatar) is decreasing. Collectibles (series combinations) and Metaverse (metaverse) volume is increasing. The types of participation in the NFT market are constantly enriching, from only Avatar (avatar/virtual avatar) at the beginning to ten categories today. While expanding the category, the market cake is also expanding rapidly.
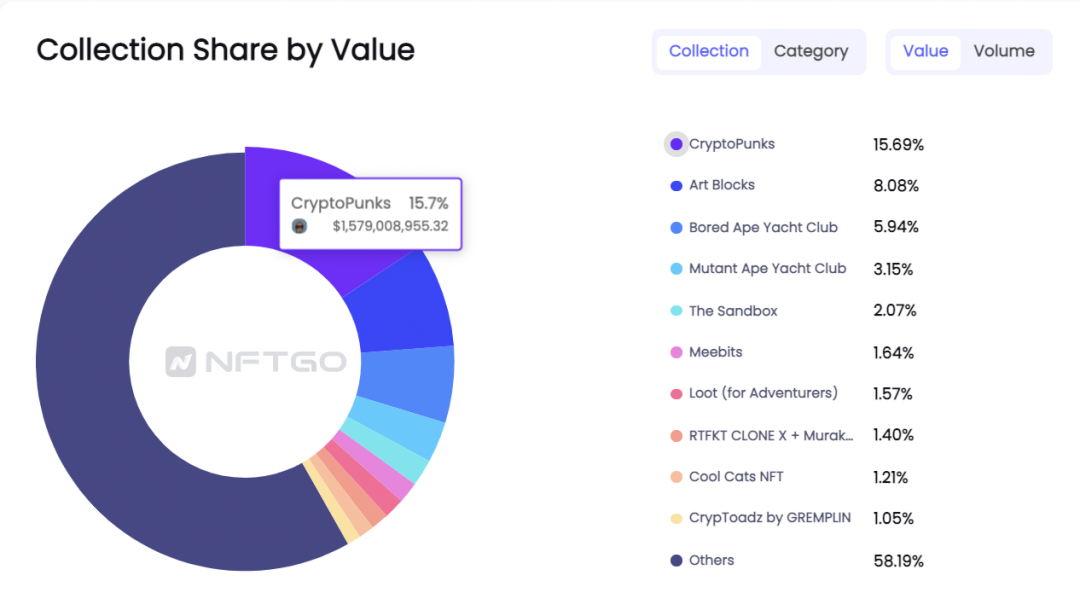
According to the data from nftgo.io, as of December 29, 2021, the NFT series with the highest market capitalization is CryptoPunks, accounting for 15.7%; followed by Art Blocks, Bored Ape Yacht Club, Mutant Ape Yacht Club and The Sandbox accounts for 8.08%, 5.94%, 3.15% and 2.07% respectively.
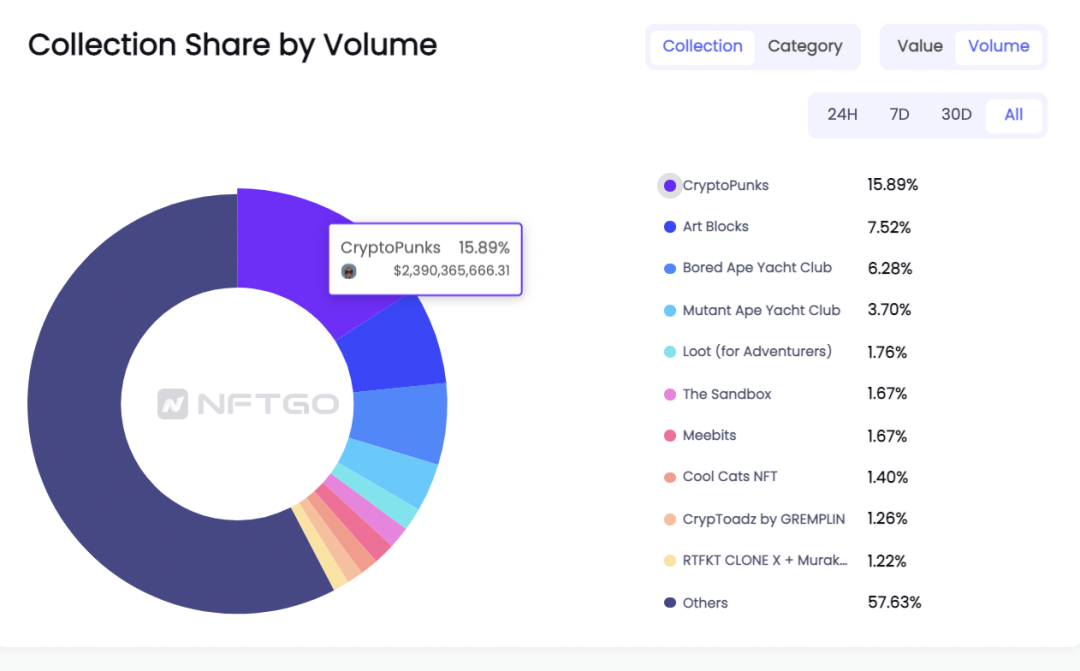
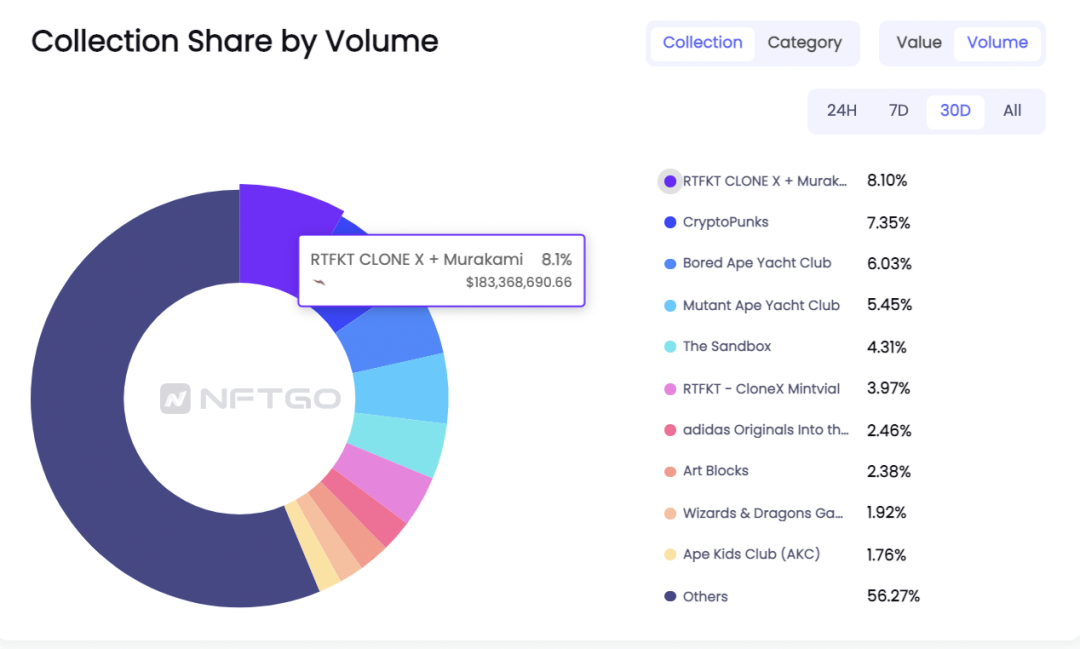
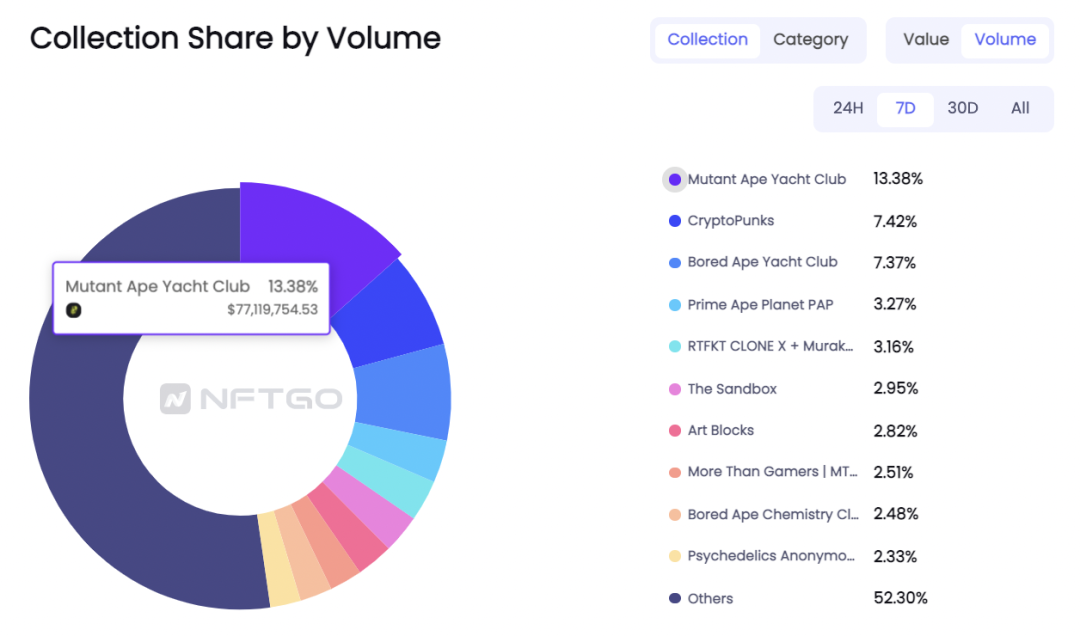
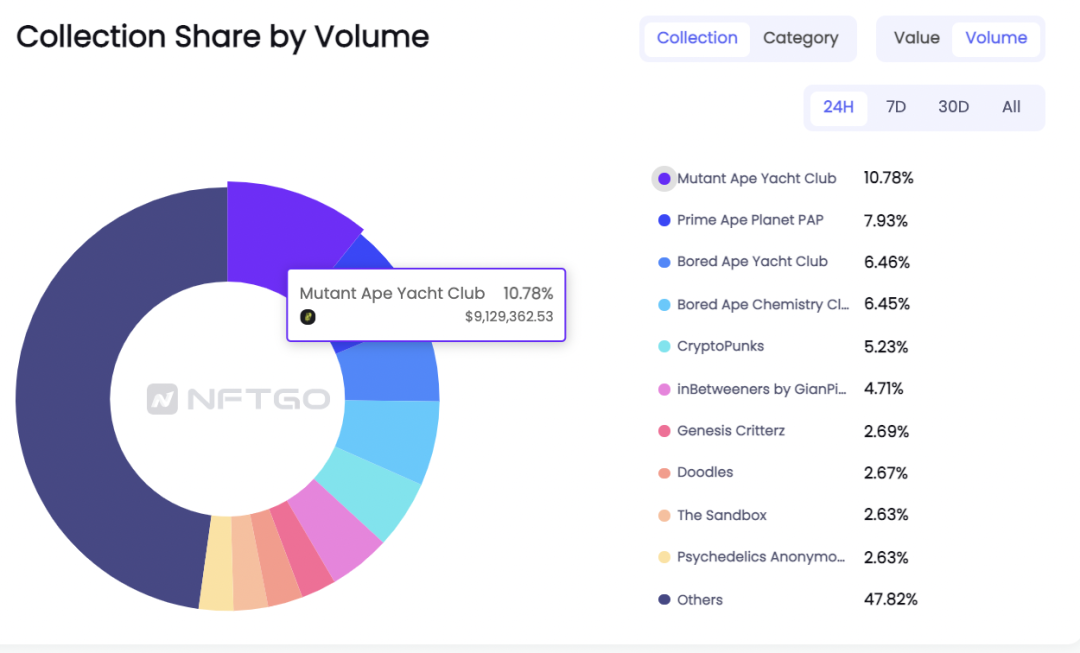
The proportion of NFT trading volume in different series (Figure 1: All historical data as of December 29, 2021, Figure 2: Data in December 2021, Figure 3: Data in the last week of December 2021, Figure 4: December 29, 2021 daily data) data source: nftgo.ioJudging from the historical data of all NFT trading volumes as of 2021.12.29, it is consistent with the data on the proportion of NFT market value. However, judging from the 24H/7D/30D data, there will be some interesting discoveries. The series with the top trading volume will take turns. On December 29, 2021, the 24H list is 10.78% of Mutant Ape Yacht Club, and the last one in December 2021 Mutant Ape Yacht Club is still at the top of the list this week, accounting for 13.38%, and the popularity continues. Looking at the data for December 2021, RTFKT CLONE X + Murakami jumped to the top of the list, accounting for 8.1% of the monthly trading volume. The 24H/7D/30D data seems to be inconsistent with the historical capital.