Original compilation: 0x11, ForesightNews
Original compilation: 0x11, ForesightNews
We are excited to share the Chainalysis 2022 Global Cryptocurrency Adoption Index. For the third year in a row, we rank all countries by grassroots cryptocurrency adoption. In this article, we will cover:
What is Grassroots Cryptocurrency Adoption?
our methodology
Top 20 Global Cryptocurrency Adoption Index 2022
The main content of the index
What is grassroots adoption of cryptocurrencies?
Think of it this way: we can easily rank countries by raw cryptocurrency trading volume, so you can get a first-hand look at where cryptocurrency activity is happening. But that's not what we're interested in, the goal of our index is toA measure of where most people are putting the lion's share of their money into cryptocurrencies. While institutional activity is important for this, we also want to highlight the countries where individual, non-professional investors are most receptive to crypto assets. You can read how we do this below to see how we do it, then move on to see our index's top 20.
our methodology
ourThe Global Cryptocurrency Adoption Index is made up of five sub-indices, each sub-index is based on the use of different types of cryptocurrency services by country. We rank the 146 countries for which we have sufficient data for each of these five indicators, take the geometric mean of each country's rank in all five indicators, and then normalize the final number from 0 to 1, as Each country scores points to determine the overall ranking. The closer a country's final score is to 1, the higher its ranking.
To calculate our sub-indices, we estimate national cryptocurrency trading volumes for different services and protocols based on the web traffic patterns of those services and protocol websites. Reliance on web traffic data means that there is potential for the use of VPNs and other products to mask online activity, but given our calculations consider hundreds of millions of transactions, VPN use would need to be very widespread to meaningfully distort our data. The experts we interviewed generally felt that the index matched their view of the markets in which they operate, giving us added confidence in the methodology.
Below, we list the five sub-indices and how they are calculated.
On-chain cryptocurrency value received by centralized exchanges, weighted by purchasing power parity (PPP) per capita
The goal of this sub-index is to rank each country based on the total cryptocurrency activity taking place on centralized services. We calculate this metric by estimating the total cryptocurrency received by users of centralized services in each country, weighting on-chain value by purchasing power parity per capita, which is a measure of wealth per capita in the country. The higher the ratio of earned on-chain value to PPP per capita, the higher the ranking. If two countries receive equal value in cryptocurrency, the country with the lower PPP per capita will rank higher.
On-chain retail value received by centralized exchanges, weighted by purchasing power parity per capita
The goal of this indicator is to measure the activity of non-professional individual cryptocurrency users in centralized services, based on the amount of cryptocurrency they trade compared to the wealth of ordinary people. We estimate individual cryptocurrency activity by measuring the volume of cryptocurrency in retail transactions (retail transactions are defined as cryptocurrency transactions worth less than $10,000). We then rank each country on this metric, but weight it to favor countries with lower per capita PPP.
Peer-to-peer (P2P) transaction volume, weighted by purchasing power parity per capita and number of Internet users
P2P transaction volume accounts for a large percentage of all cryptocurrencies in emerging markets. For this sub-index, we rank countries by P2P transaction volume and weight them to favor countries with lower PPP per capita and fewer Internet users, with the goal of highlighting that more residents invest a larger share of overall wealth in P2P transactions s country.
Value of on-chain cryptocurrencies received from DeFi protocols, weighted by purchasing power parity per capita
DeFi has been one of the fastest growing areas of cryptocurrency over the past two years. In fact, as we have seen in the case of DEXs vs. CEXs, transaction volumes on decentralized cryptocurrency protocols that primarily use Ethereum rather than Bitcoin have outstripped centralized services. Given the importance of DeFi to cryptocurrency innovation, we wanted the adoption index to highlight countries with a high percentage of users' financial activity in DeFi protocols. For this sub-index, we rank countries by DeFi transaction volume and favor countries with lower PPP per capita.
On-chain retail value from DeFi protocols, weighted by purchasing power parity per capita
Just as we want our indices to incorporate the activities of non-professional individual cryptocurrency users into centralized services, so does DeFi. As such, the sub-index ranks each country by the volume of DeFi transactions made in retail-scale transfers, weighted in favor of countries with lower PPP per capita.
How our approach has changed this year
This year our index methodThe biggest change is the addition of two sub-indices based on DeFi transaction volume, and the modification of two other sub-indices to only include transaction volume related to centralized services.We did this for two reasons: First, as we explained above, it highlights countries that are leaders in the DeFi space, given its importance to the entire cryptocurrency ecosystem. Second, we want to solve the problem of DeFi-driven transaction volume inflation. Deposits and withdrawals to centralized services show up in on-chain transaction volume, but transactions within those services, such as those conducted on centralized exchanges, do not. Centralized services track volume internally, such as order books for trades, which means we don't have access to it exactly. But the DeFi protocol is different. Since the DeFi protocol is non-custodial and only transfers cryptocurrencies between private wallets, all DeFi transactions are displayed on the chain. This means that if you use on-chain data, the transaction volume of DeFi protocols will explode, while the transaction volume of centralized services related to it will not. This could lead us to artificially favor countries with higher DeFi adoption over countries with more activity in centralized services, even if the actual volume of transaction activity is the same.
To address this, we decided to measure CeFi and DeFi volumes in each country separately — both at aggregate and retail levels — and use them as equal components of the overall index. This allows for a more accurate comparison of transaction volumes in each country, and we can transparently understand which countries have relatively high transaction volumes in the DeFi ecosystem.
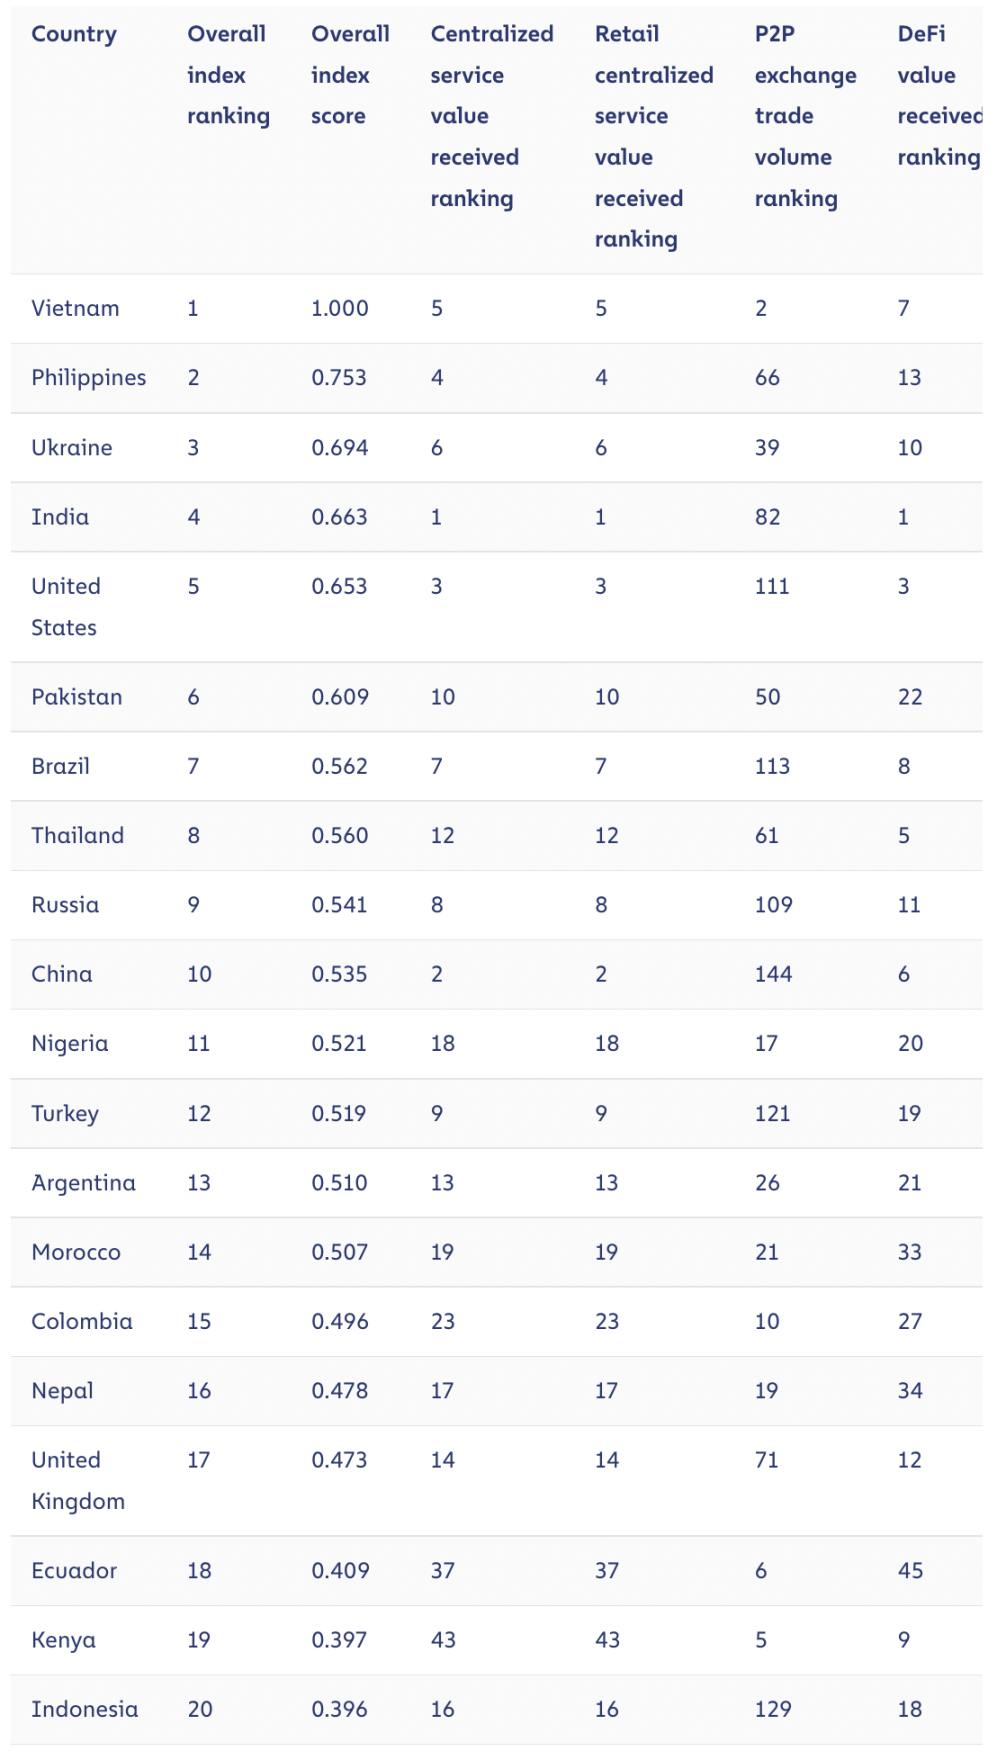
Top 20 Global Cryptocurrency Adoption Index 2022
Key findings from the 2022 Cryptocurrency Adoption Index
Overall global adoption slows in bear market, but remains above pre-bull market levels
The data showed global adoption leveled off last year after a sustained increase since mid-2019. The table below captures this trend, where we apply our index methodology globally, summing the index scores for all 154 countries quarterly from Q2 2019 to present, and re-indexing the number again to show Global adoption growth over time.
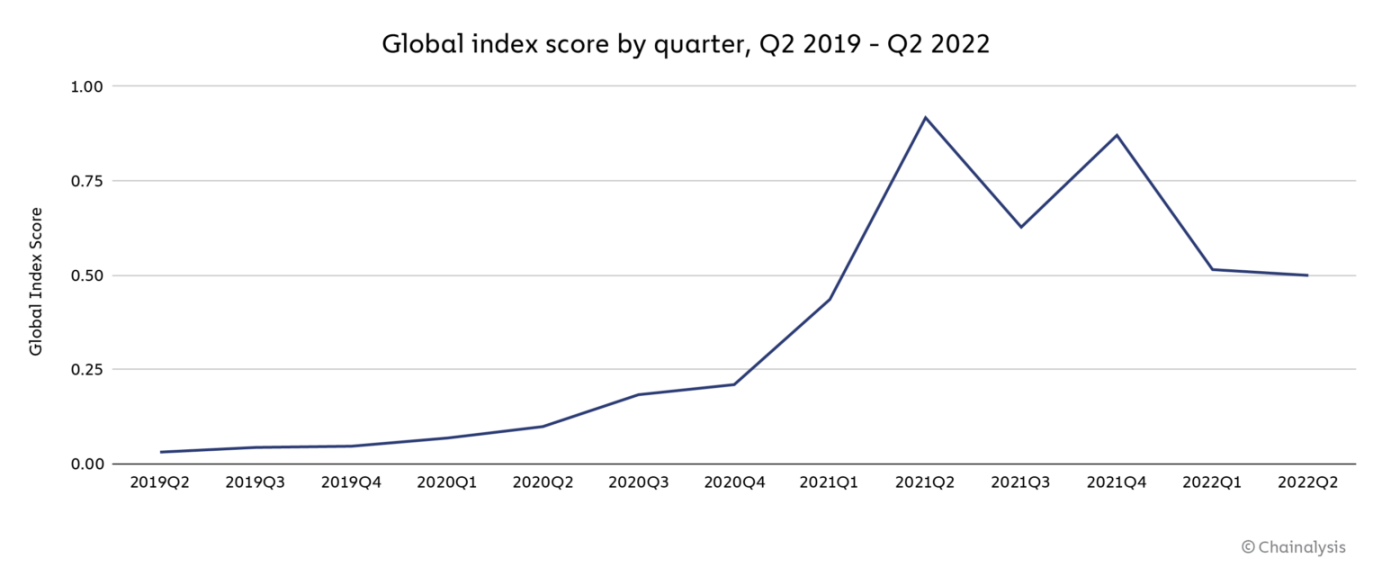
Global cryptocurrency adoption reached an all-time high in Q2 2021. Since then, adoption has come in waves - it dipped in the third quarter, causing cryptocurrency prices to fall, rebounded in the fourth quarter, when we saw cryptocurrency prices rise to new all-time highs, and as we entered a bear market, It has fallen in each of the past two quarters. Still, it’s worth noting that global adoption remains well above levels seen before the 2019 bull run.
The data suggests that many people who were attracted to the price increases in 2020 and 2021 stayed put and continued to invest a large portion of their assets in crypto assets. This also relates to ourPrevious researchUnanimously, the cryptocurrency market has been surprisingly resilient during the recent decline. Large long-term cryptocurrency holders continue to hold in a bear market, so while their portfolios have depreciated, these losses have not been locked in because they have not sold - on-chain data shows that these holders remain optimistic about the market, This keeps market fundamentals relatively healthy.
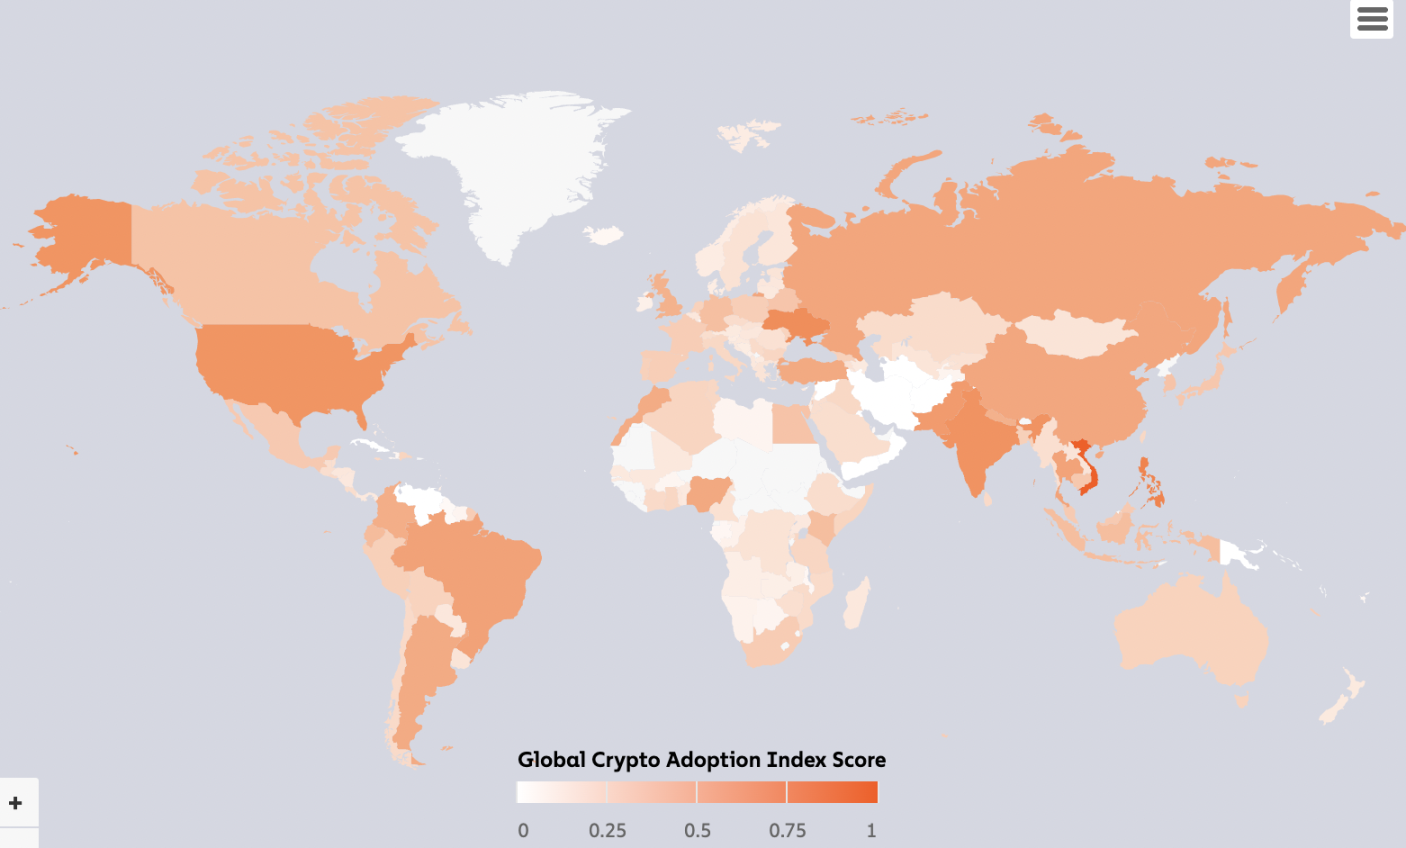
Emerging Markets Dominate Global Cryptocurrency Adoption Index
A trend we noticed last year has grown even stronger this year: Emerging markets dominate the adoption index.world bankCountries are divided into four categories based on income levels and overall economic development: high-income, upper-middle-income, lower-middle-income, and low-income. Using this framework, we find that the middle two categories dominate our index. Among our top 20 countries:
Ten are low- and middle-income countries: Vietnam, Philippines, Ukraine, India, Pakistan, Nigeria, Morocco, Nepal, Kenya, and Indonesia
8 upper-middle-income countries: Brazil, Thailand, Russia, China, Turkey, Argentina, Colombia, and Ecuador
2 high-income countries: US and UK
As we explore later in the report, users in low- and upper-middle-income countries often rely on cryptocurrencies to send remittances, preserve their savings when fiat currencies fluctuate, and meet other financial needs specific to their economies. These countries also tend to rely on Bitcoin and stablecoins more than others. Over the next few years, look forward to what solutions the cryptocurrency industry can build to increase adoption in both high- and low-income countries.
Vietnam secures top spot, US jumps to fifth, China returns to top 10
There are also individual country rankings that stand out to us.
Vietnamsecond consecutive yearRanked #1 in cryptocurrency adoption. Looking at the sub-rankings, Vietnam shows very high purchasing power and population-adjusted adoption in centralized services, DeFi, and P2P transactions. Other sources also show Vietnam’s enthusiasm for cryptocurrencies. Polls conducted in 2020 found that,21% of Vietnamese consumersSecond only to Nigeria at 32% claiming to use or own cryptocurrencies, and adoption has continued to increase since then.local media reportsIt shows that cryptocurrency-based games, including games with play-to-earn (P2E) and mobile-to-earn (M2E) models, are particularly popular in Southeast Asian countries. This applies not only to users, but also to developers, as the success of Axie Infinity, the top-grossing P2E game based in Ho Chi Minh City, has inspired more crypto gaming startups to succeed in Vietnam.
The US moves up from 8th in 2021 and 6th in 2020 to 5th in the index ranking. The US ranks in the top three in every sub-index, except for P2P transaction usage adjusted for population and purchasing power, which ranks much lower at 111th. This is not surprising, as our research shows that the use of P2P transactions tends to be highest in countries with low purchasing power. Perhaps most interestingly, the US is by far the highest-ranked developed market country in our index, and one of only two developed countries to make it into the top 20, along with the UK. we will laterfull reportexplore its reasons.
Finally, China re-entered the top 10 this year after ranking 13th in 2021. Our sub-indices show that China is particularly strong in the use of centralized services, ranking second overall and at the retail level for purchasing power-adjusted transaction volume. This is especially interesting considering the crackdown on cryptocurrency activity by the Chinese government, which includes a ban on all cryptocurrency transactions announced in September 2021. Our data suggests that the ban was either ineffective or not enforced enough.
Bear Markets Can’t Kill Bull Market Adoption
As mentioned above,While cryptocurrency adoption growth has sluggish as the bear market sets in, global adoption remains well above levels seen prior to the 2020 bull run.Original link